Supplementary materials for a paper on Russian scholarly output after 2022
Here I share the core metrics for Russian scholarly output before and after 2022. This is supplementary material for my forthcoming academic paper on the matter. It is a routinely updated set of metrics that utilises the free Scopus API; the current version (v9) was collected on 25 August 2026. It has not yet been peer-reviewed.
The core concepts are:
"Anything that's in Scopus" is interesting, but not robust
-
The list of indexed sources is constantly expanding, complicating year-on-year comparisons.
-
These sources differ vastly in quality, academic rigour, visibility, readership and, ultimately, impact.
-
Thus, we supplement 'whole Scopus' with two subsets of sources selected by top international experts as the most reputable: 'a reasonably consensual upper echelon of journals in the natural sciences and health sciences' (Nature Index (NI)) and those 'approved as an academic publication channel at the highest level' (Norway Journal List, second level (NPI2)).
-
These sources are divided into areas, allowing us to explore Russia's actual influence on global science and humanities across different fields. The NI edition that we use has 145 journals; NPI2 has 2098.
International collaboration is more than just 'Russian papers with affiliations from other countries'
-
To detect real changes in bilateral academic collaboration, we need to complement this measure with a count of papers where no other countries are involved besides Russia and a given country (strictly bilateral papers).
-
This admittedly removes complex multinational projects (historically a very important source of papers in high-energy physics and health), but allows for much sharper conclusions and exposes changing trends more clearly.
Figures below are based on counts of articles, reviews, and data papers.
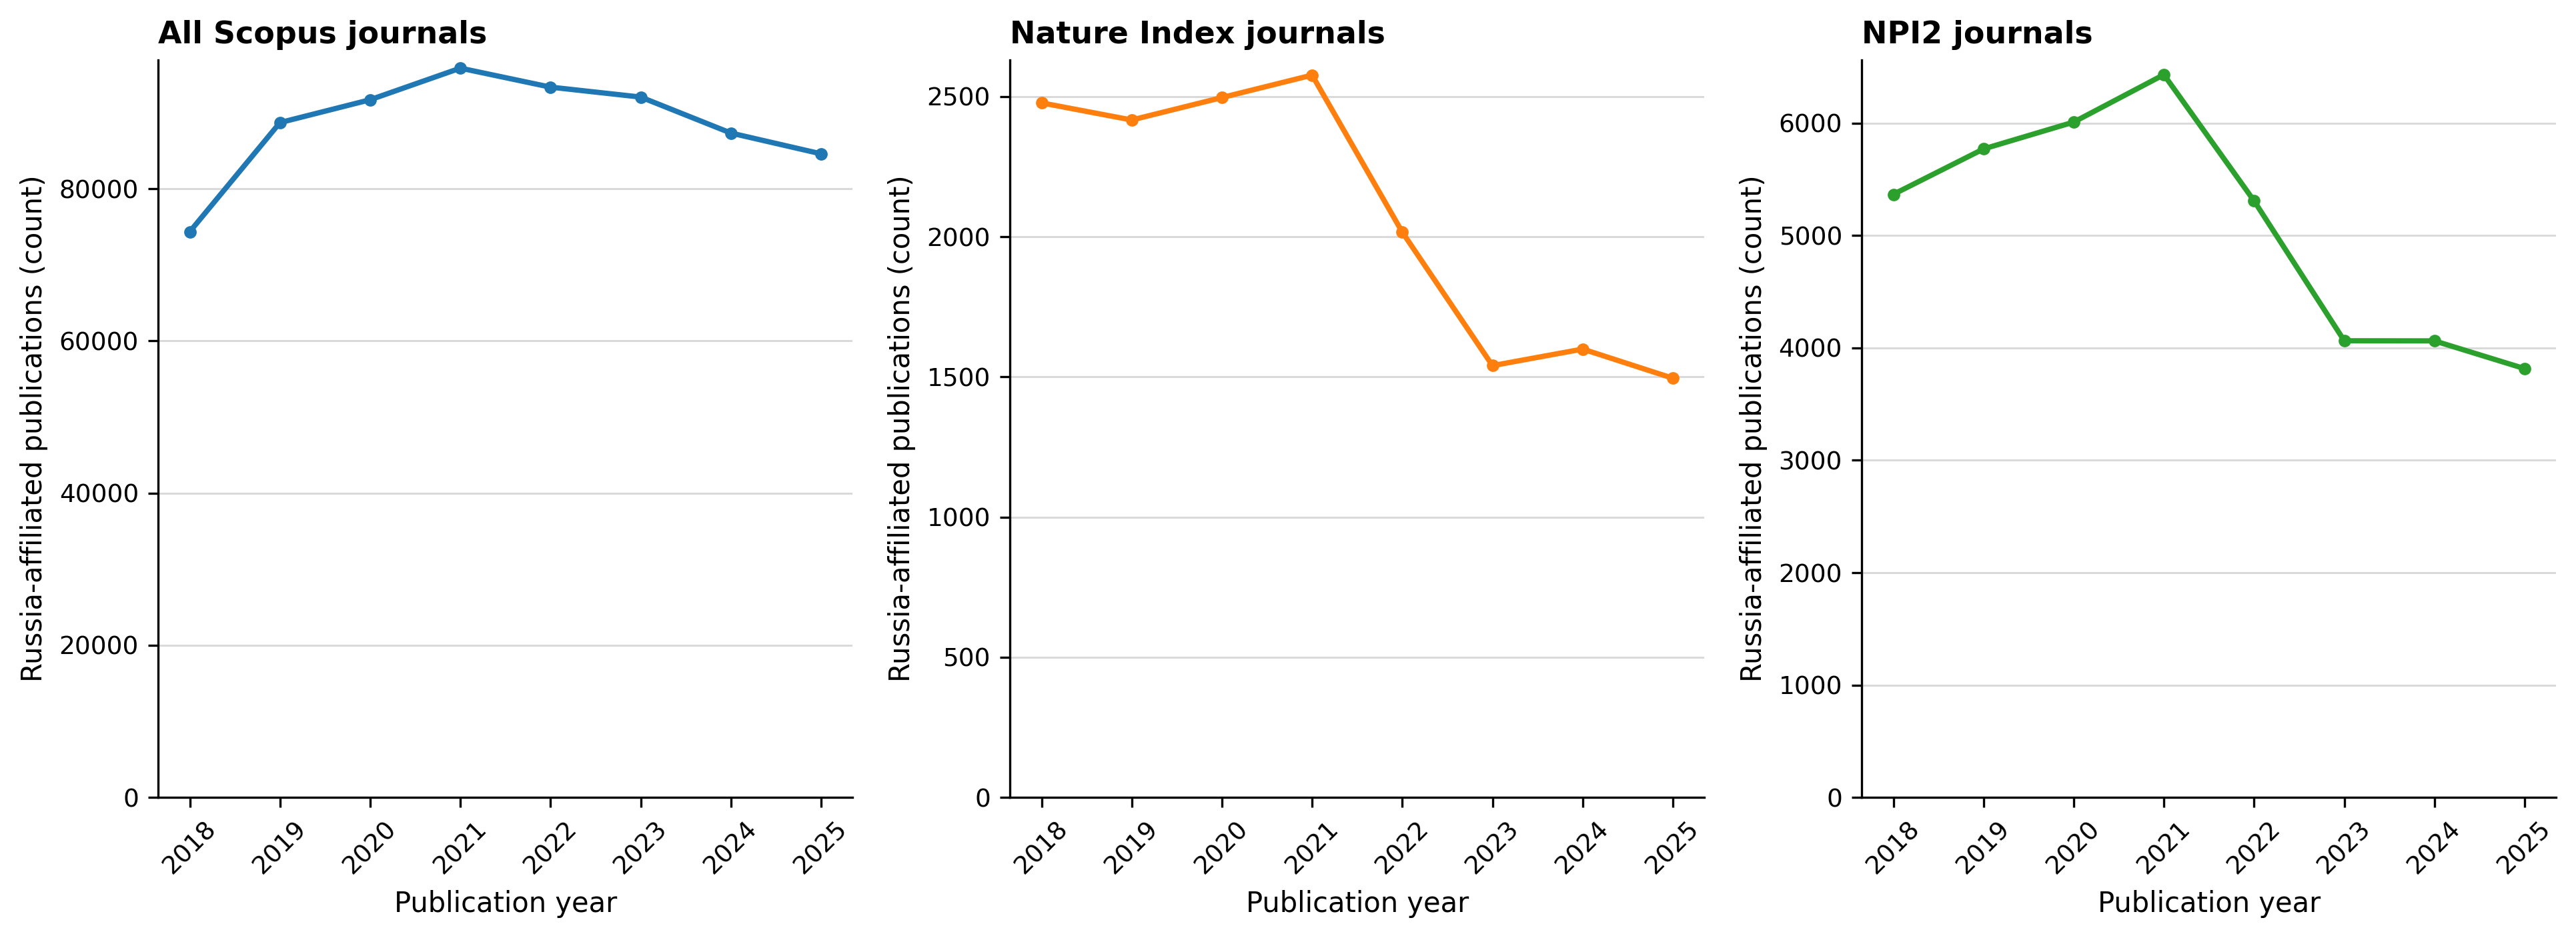
First, let's compare unfiltered and filtered paper output dynamics. Notable differences here.
Figure 1. Russia-affiliated publications in Scopus: Unfiltered vs. Nature Index and NPI2 lists, 2018–2025.
As we see from Fig. 2-3, this is for a large part due to physics and its peculiar publication and collaboration patterns (e.g. LHC) and historical focus. But note the other areas and their rapid pre-2022 growth.
Figure 2. Russia-affiliated publications in Nature Index journal-area lists, 2018–2025. Papers with at least one Russian affiliation in a journal that NI assigns to a certain area. Nature, Science, PNAS, Nat.Comm. and Sci.Adv. are 'multidisciplinary'. Counts are full publication counts rather than Nature Index fractional counts.
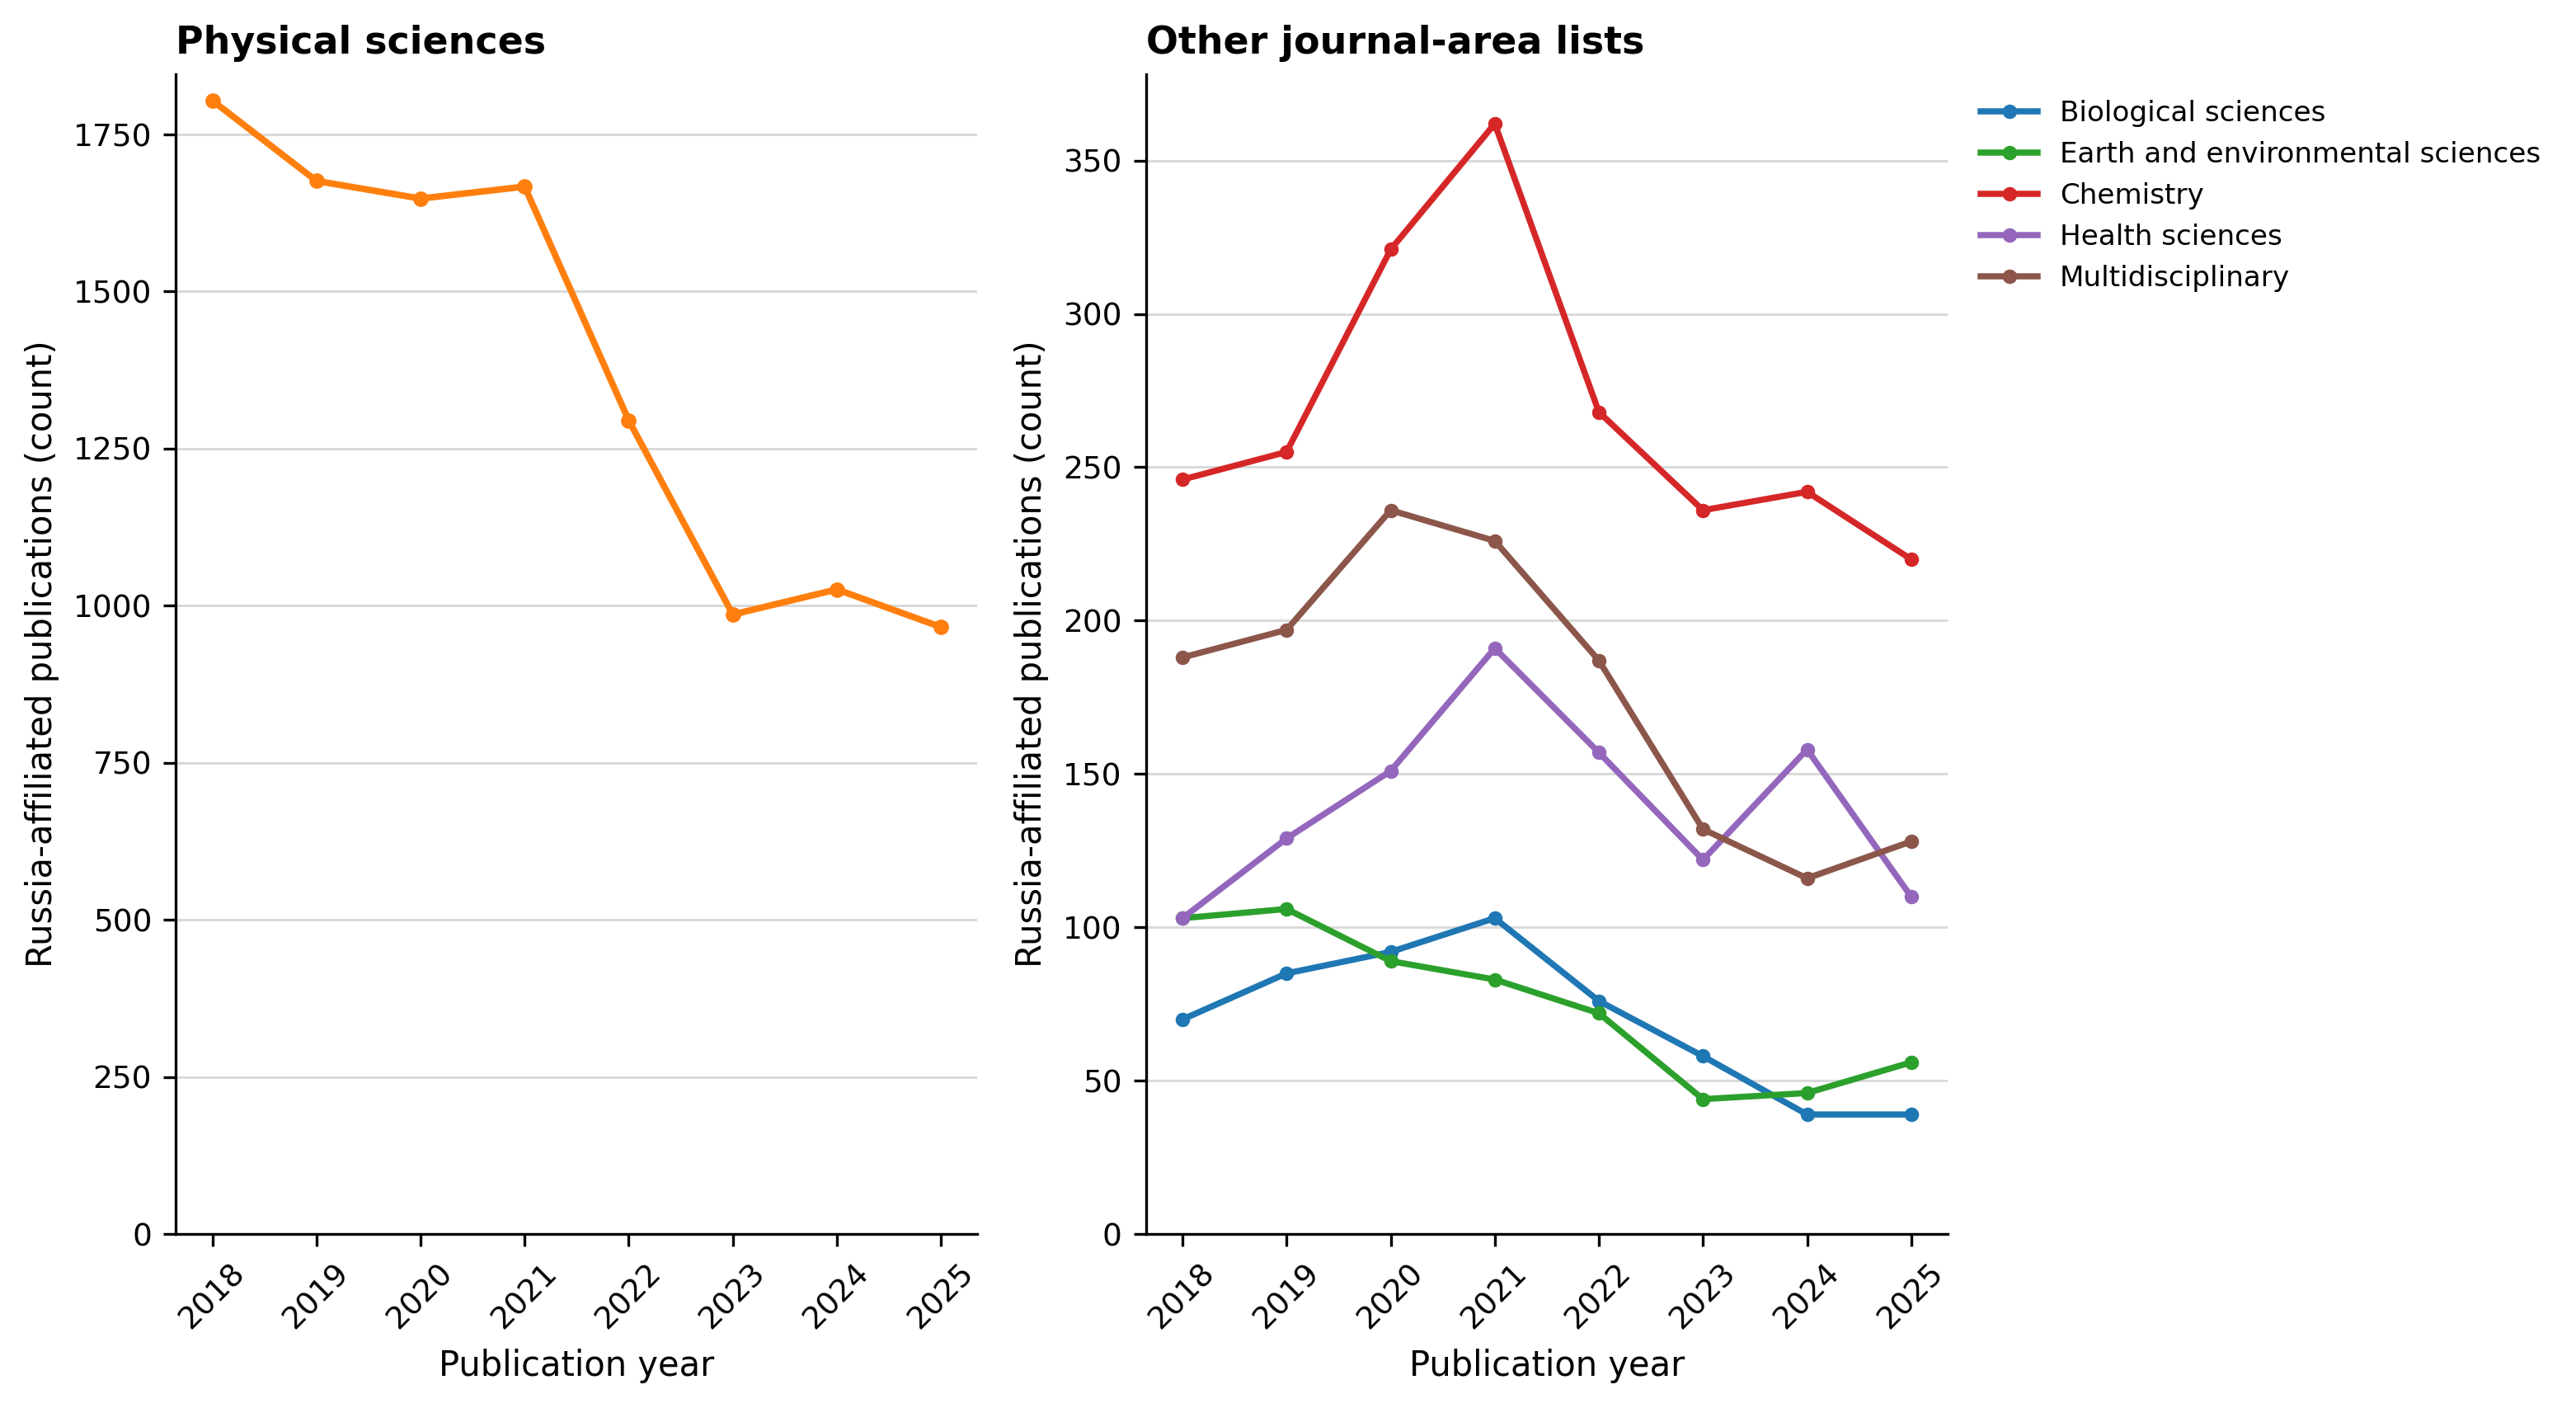
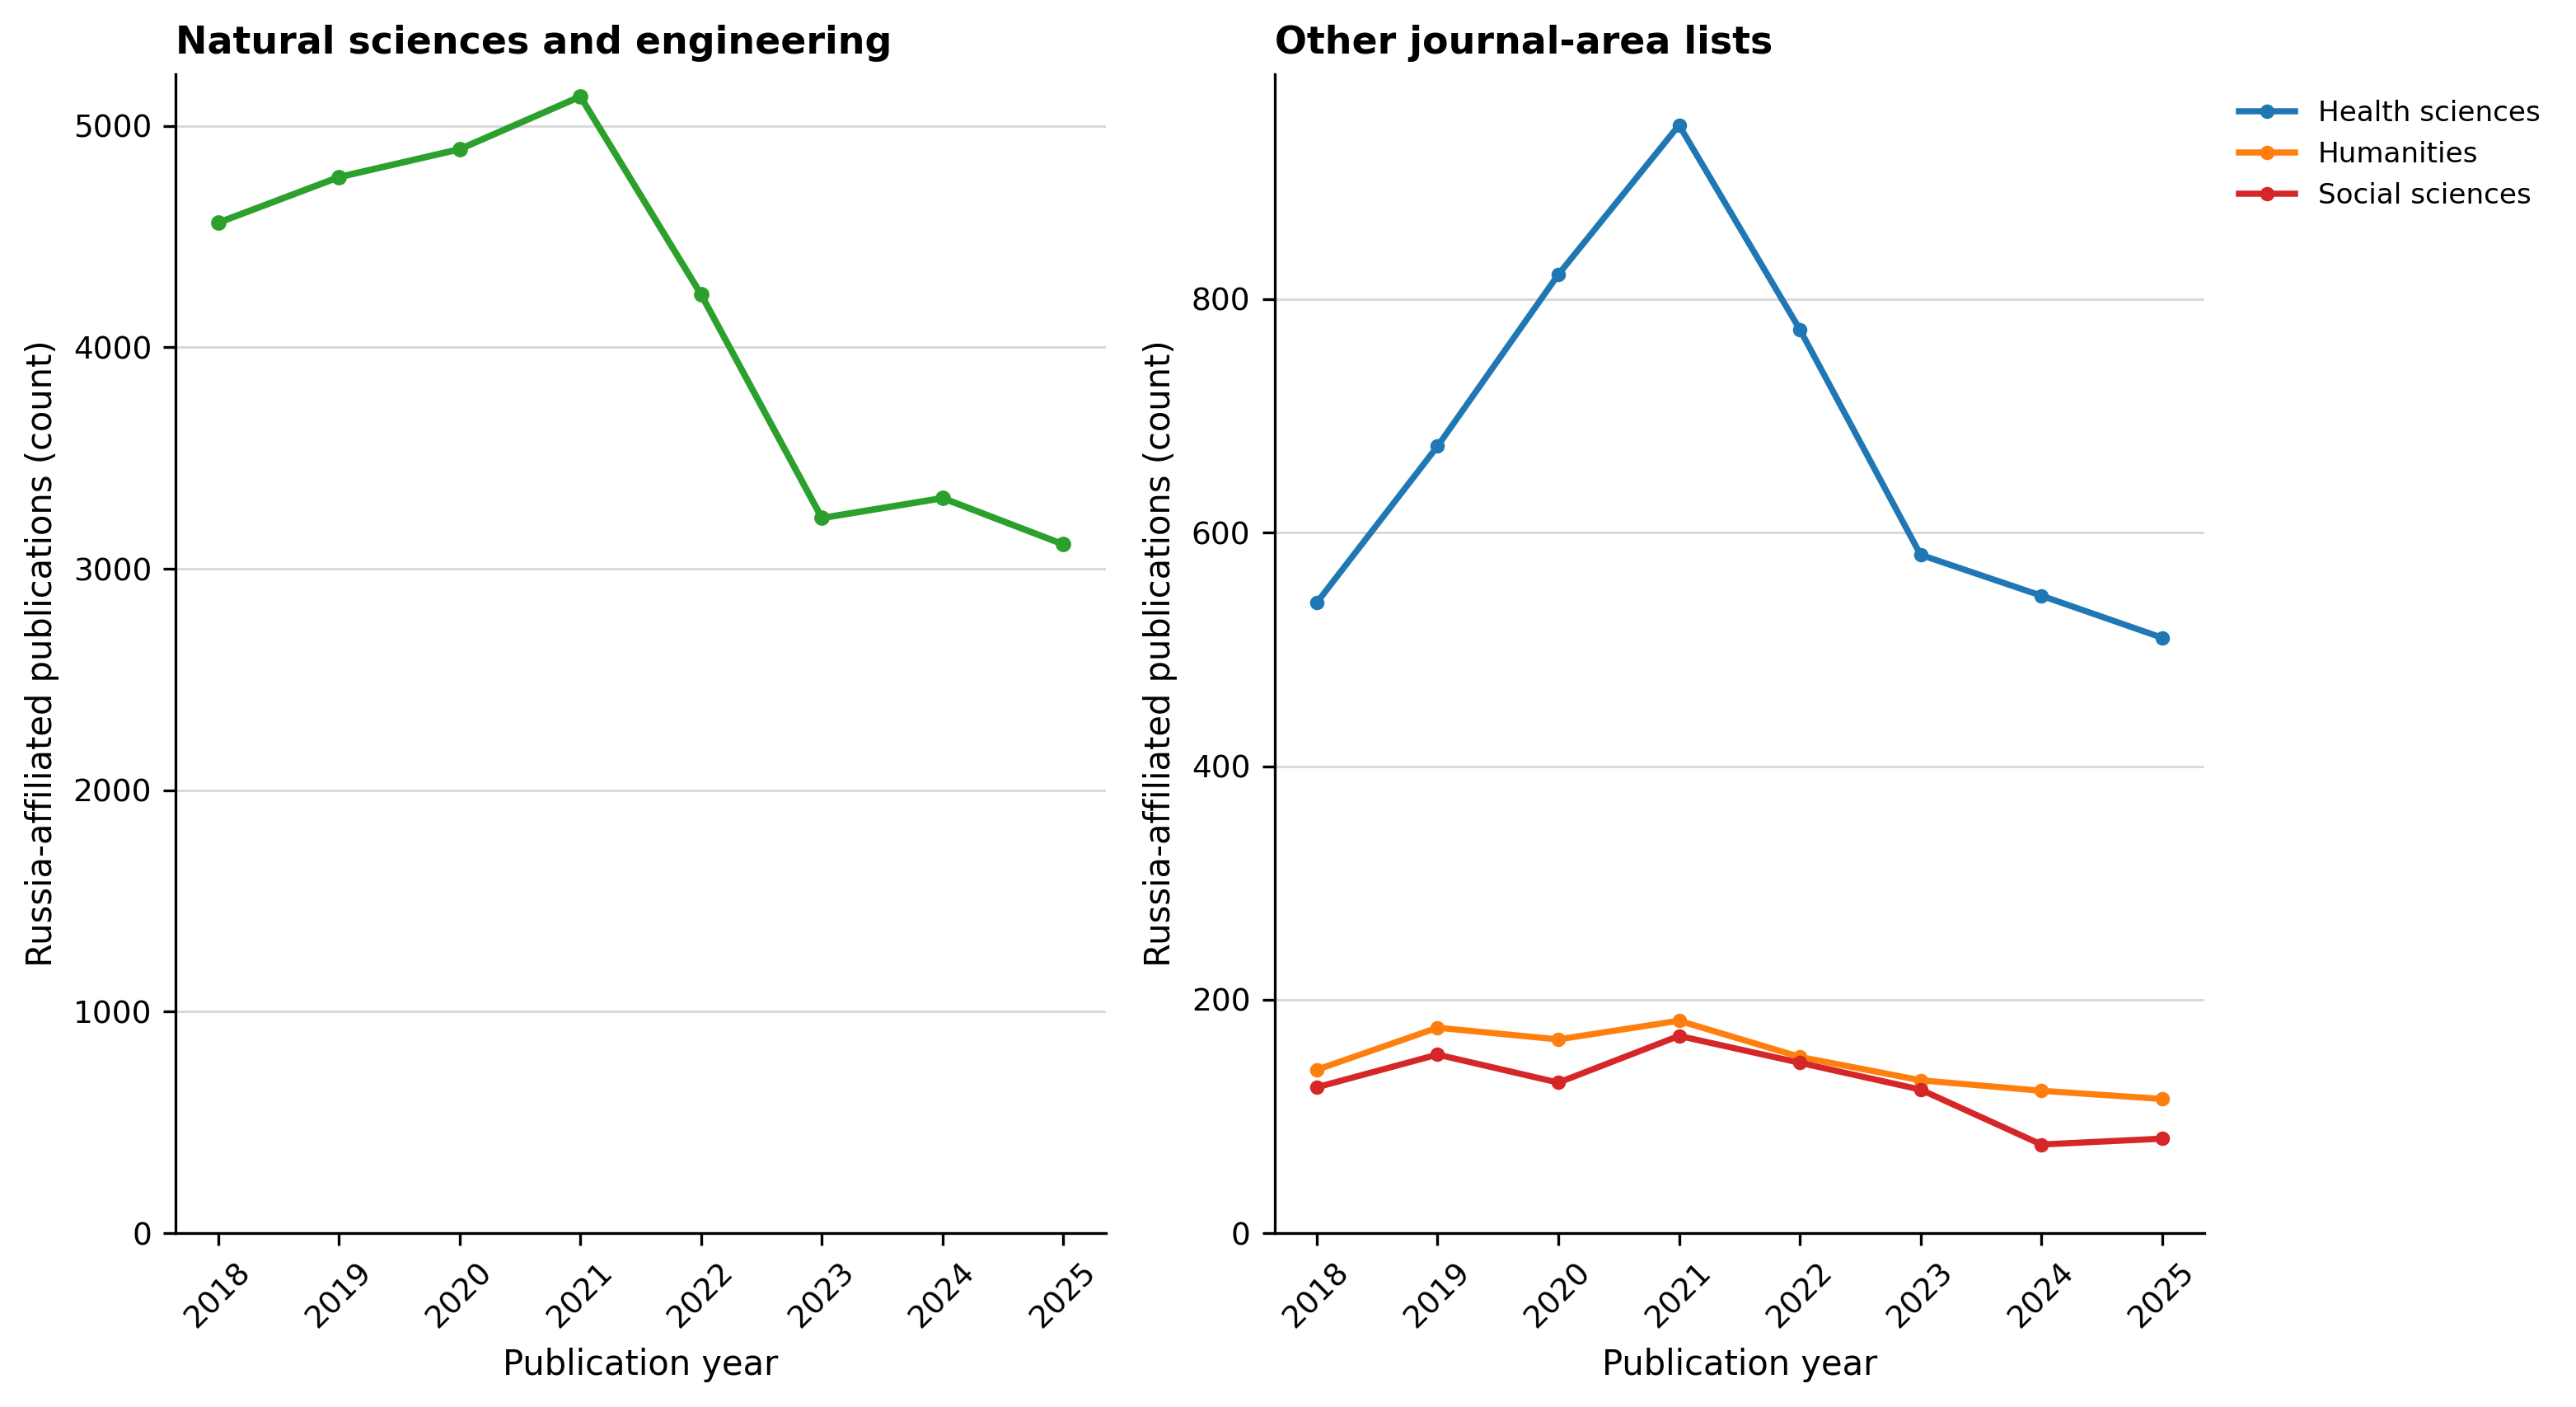
Figure 3. Russia-affiliated publications in NPI2 journal-area lists, 2018–2025. Papers with at least one Russian affiliation in a journal that Norwegian national journal assessment exercise assigns to a certain area.
Next, we compare collaboration metrics for unfiltered Scopus vs. Nature Index, and normal vs. strictly bilateral counting.
Figure 4. Publications with selected countries, 2010–2025. A paper has at least one Russian affiliation and at least one affiliation in the named partner country; affiliations from additional countries are permitted, so partner series are not mutually exclusive.
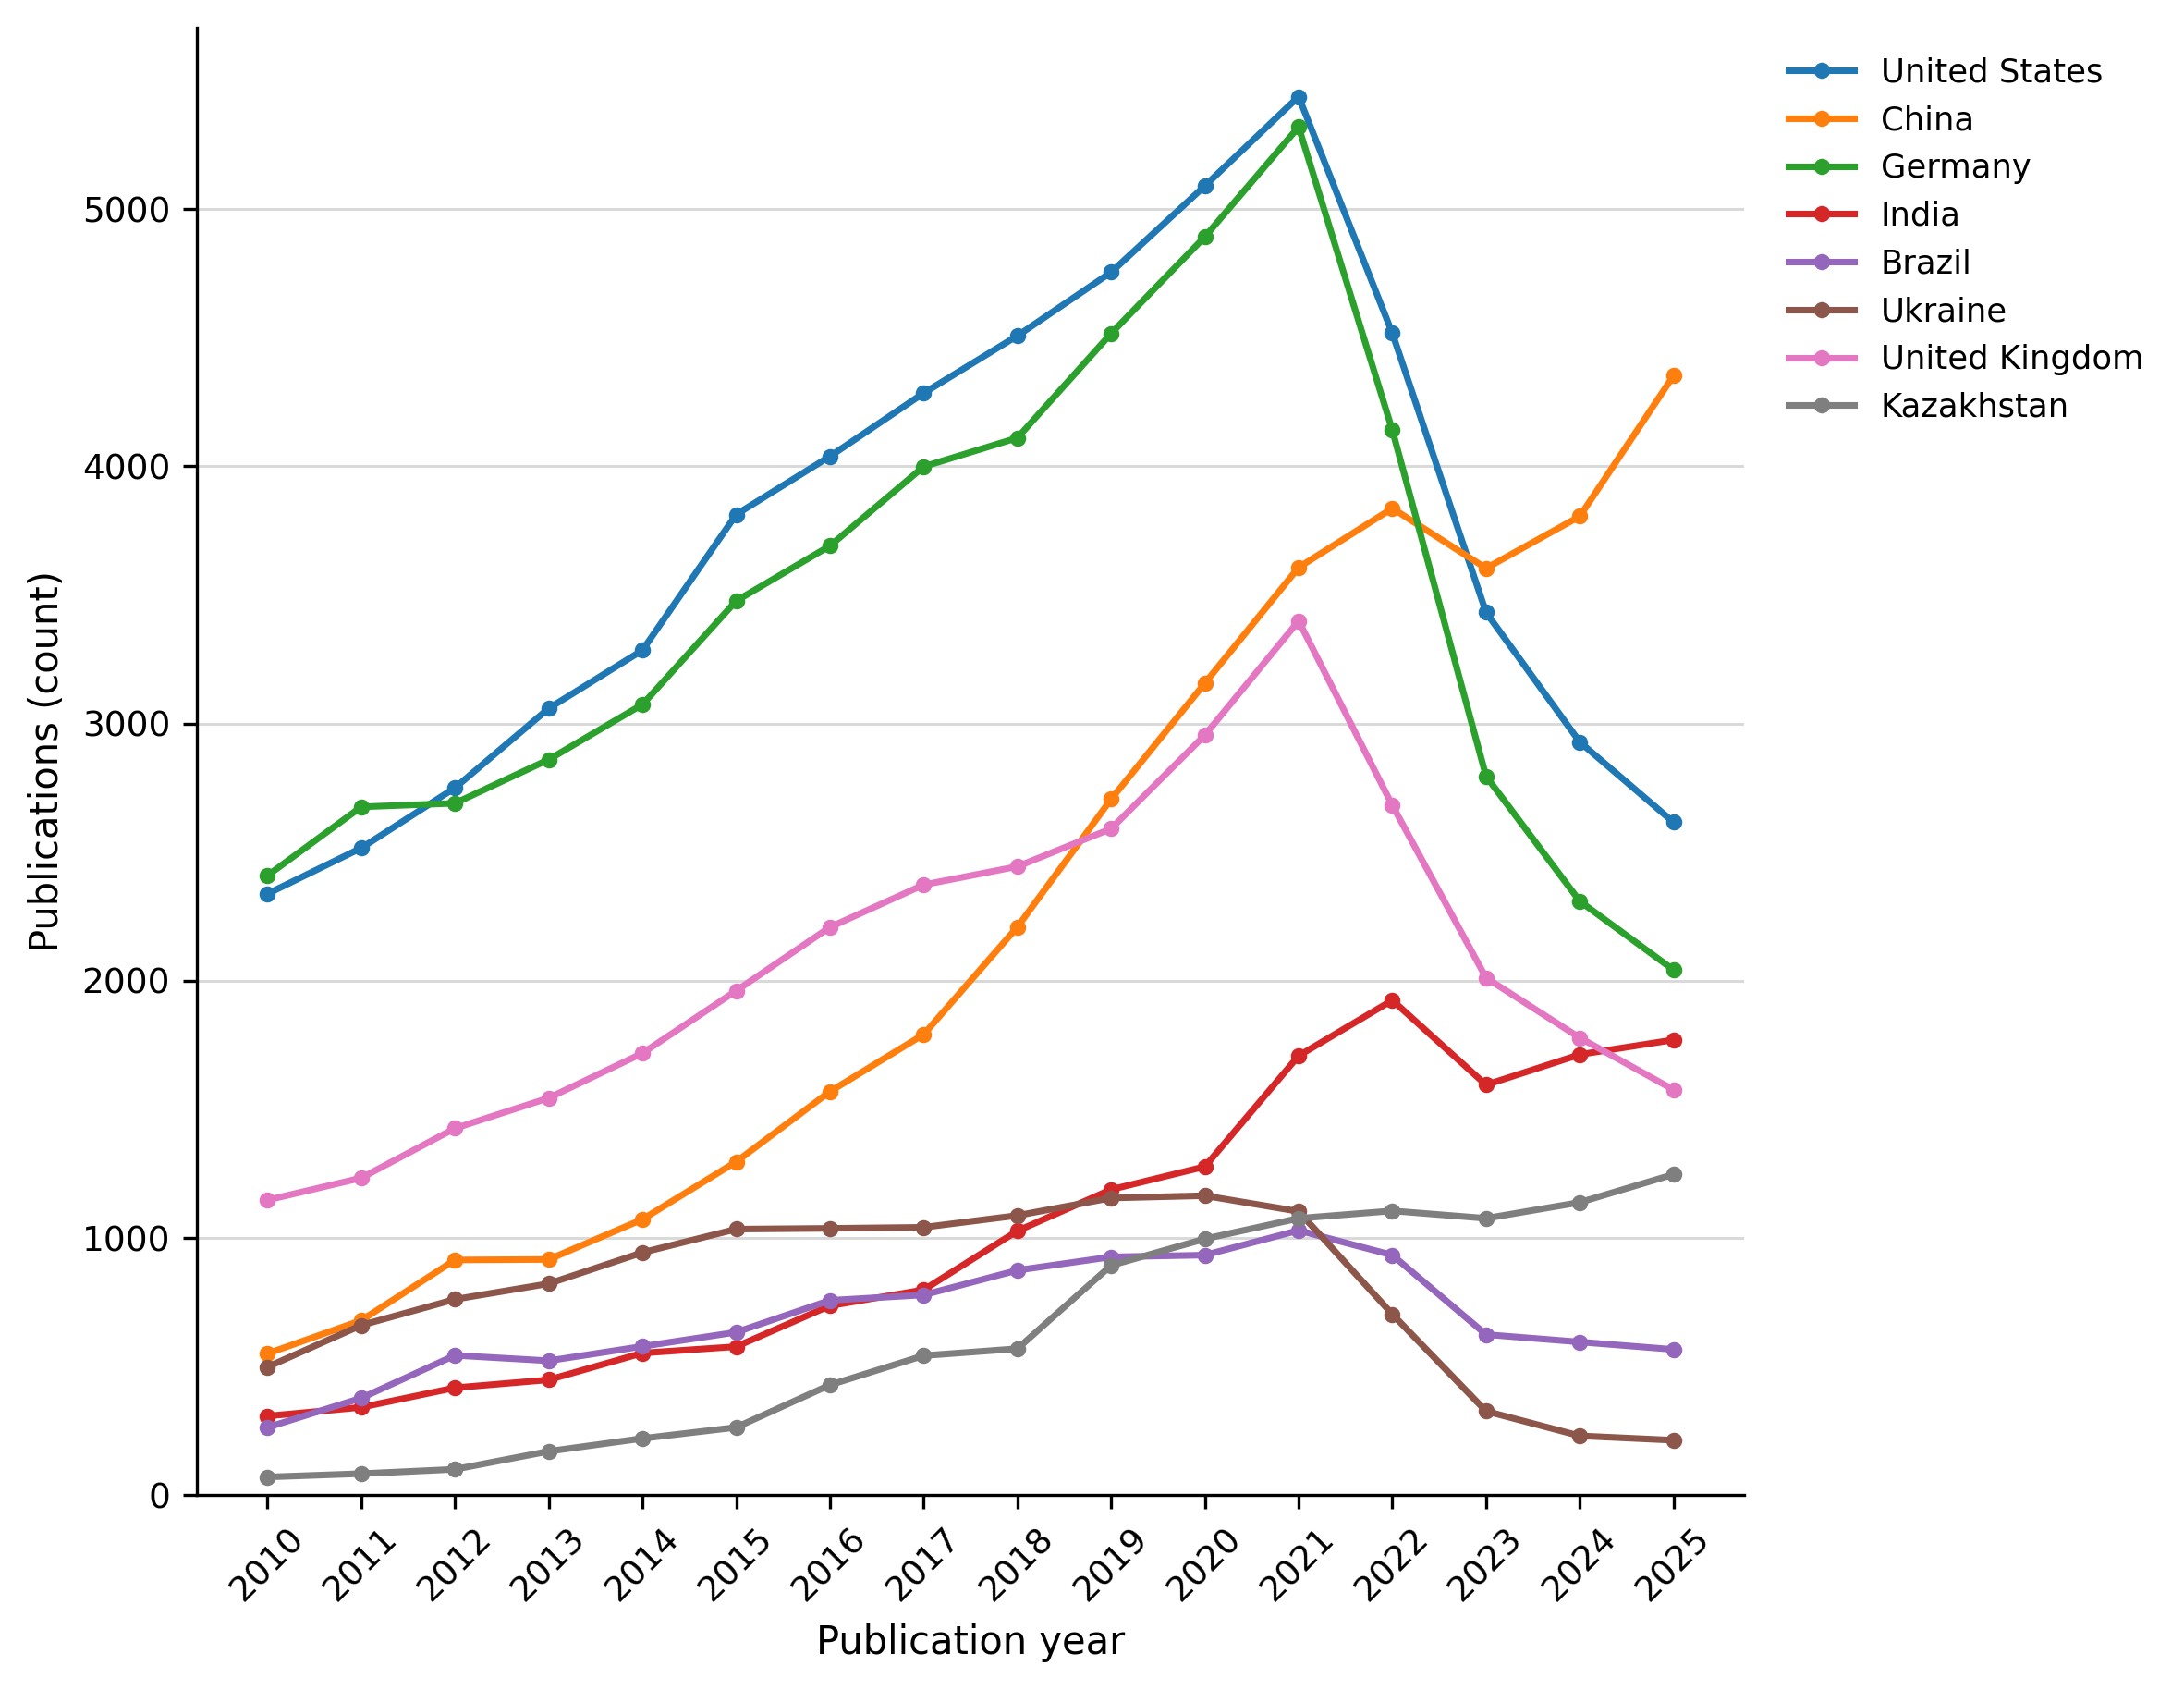
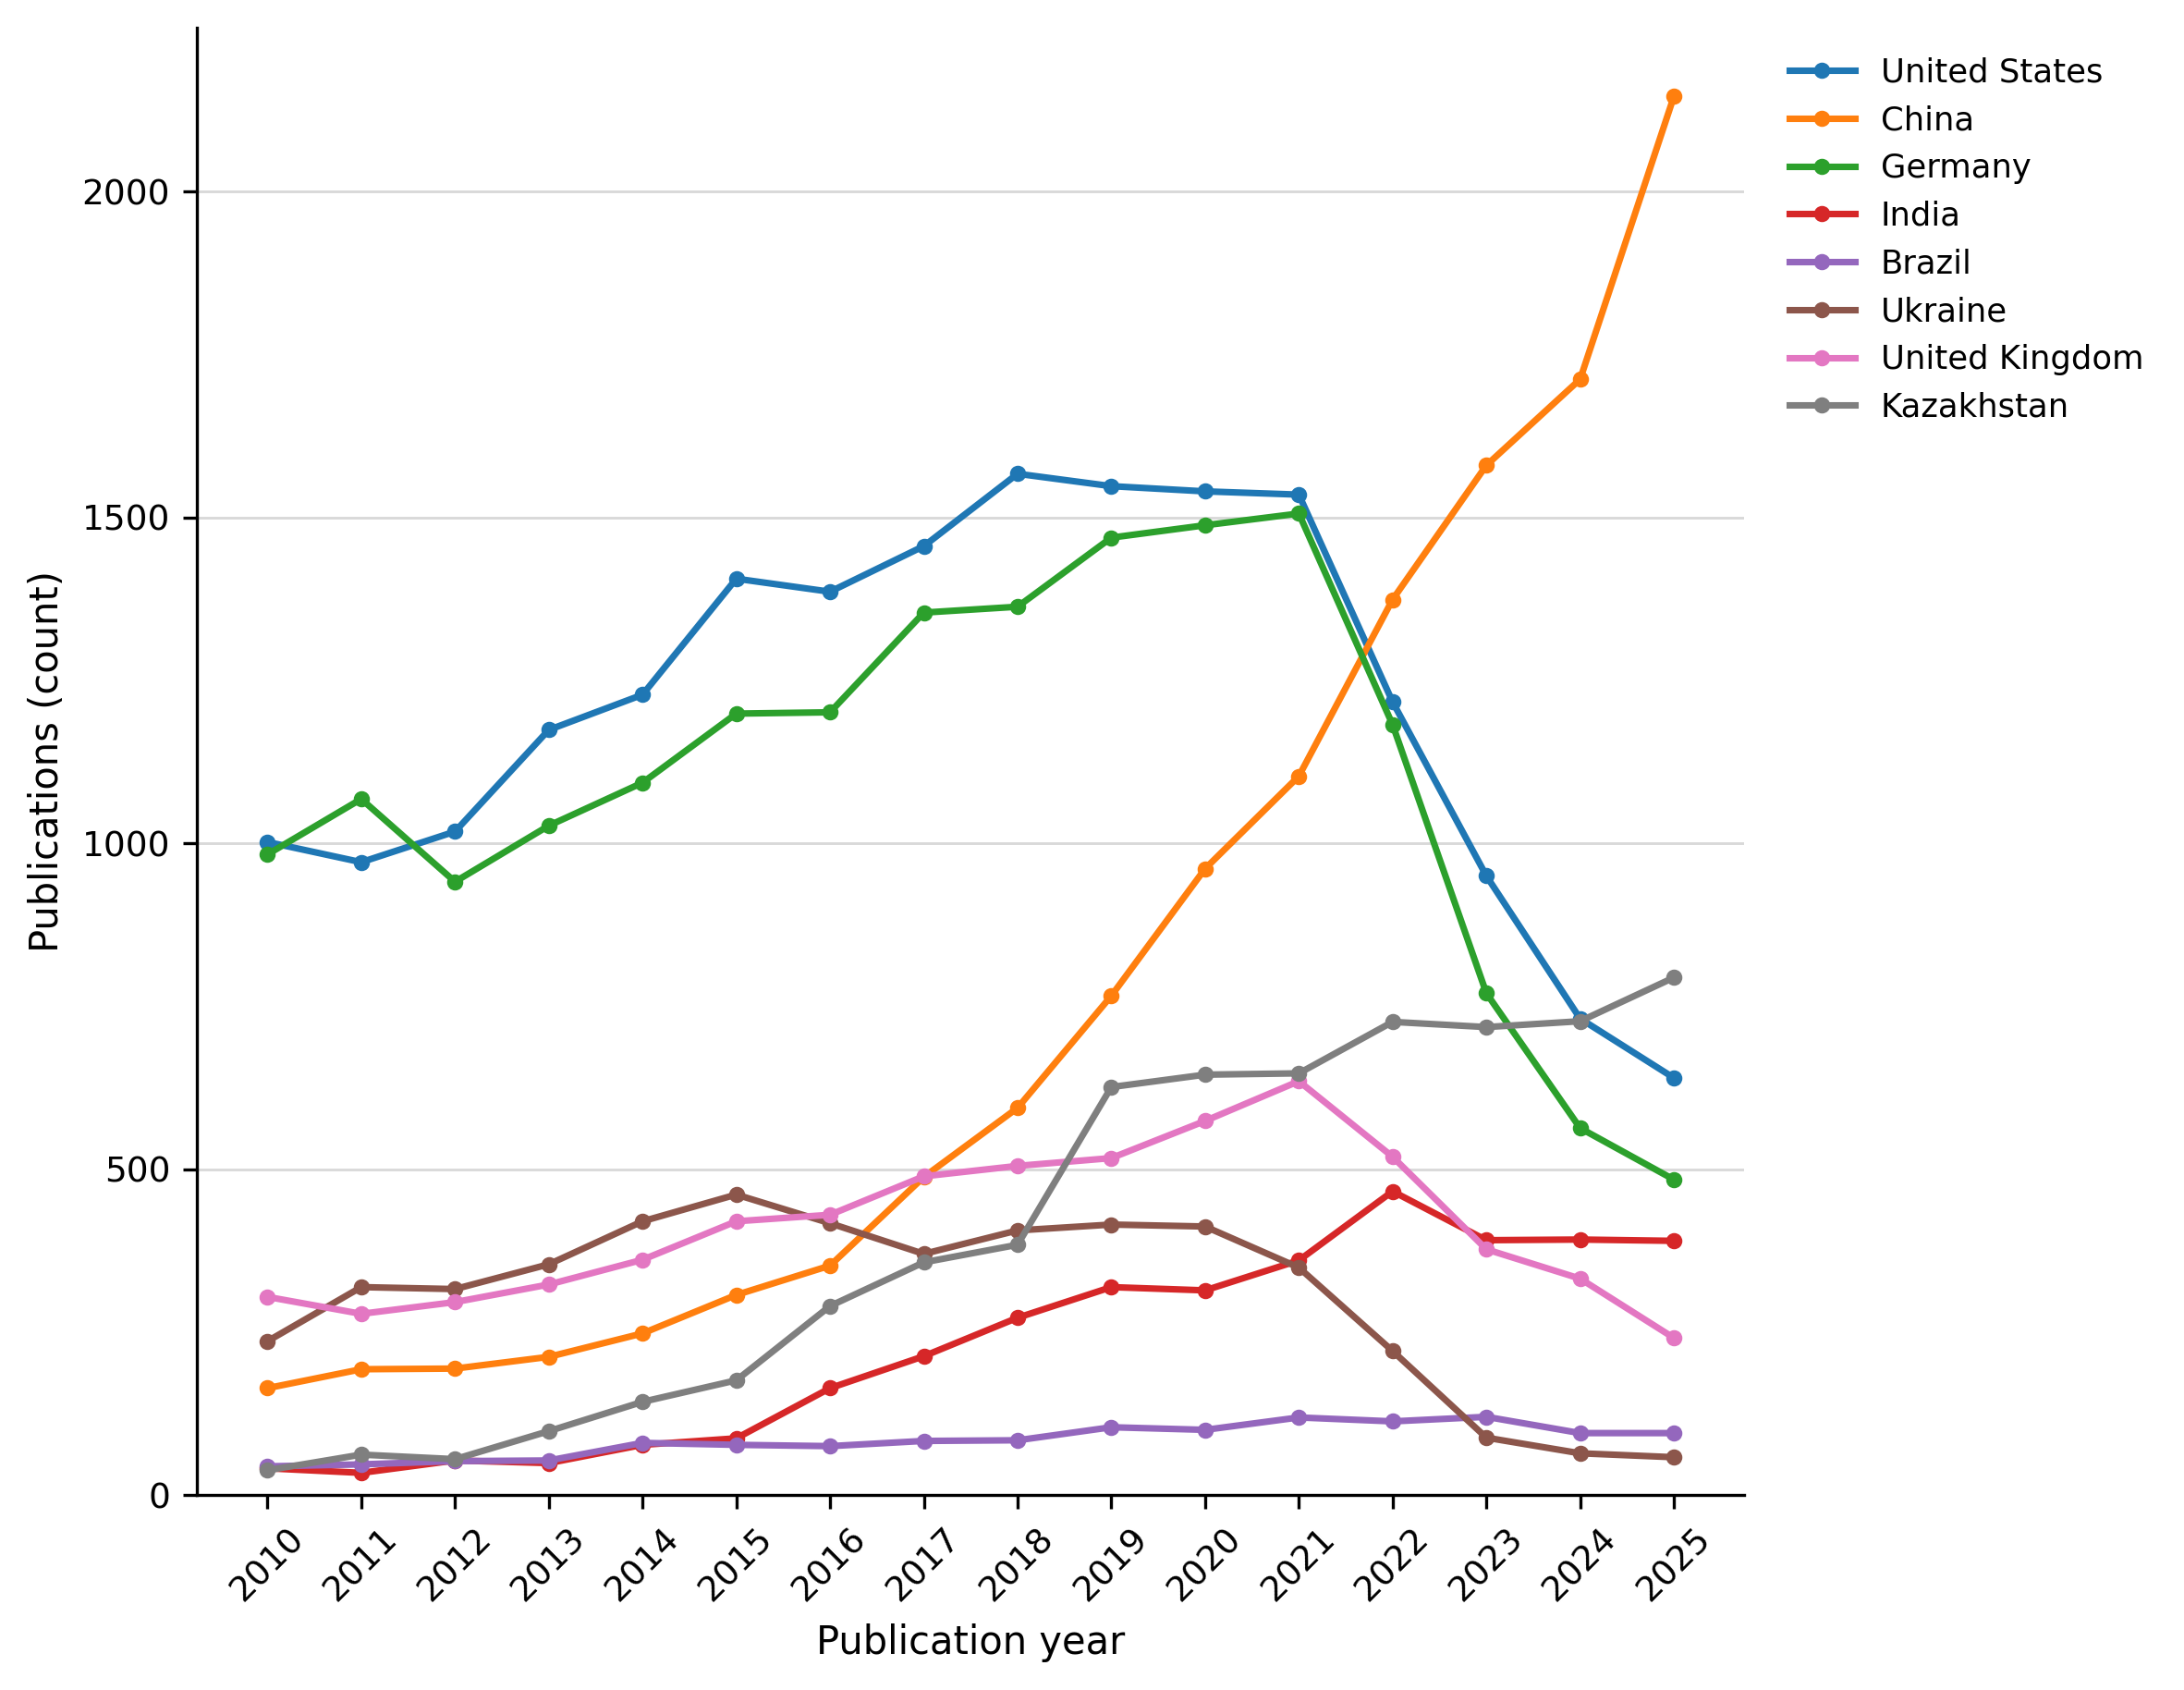
Figure 5. Strictly bilateral publication counts between Russia and selected partner countries, 2010–2025. A strictly bilateral paper has Russian and named-partner affiliations and no affiliation country other than those two.
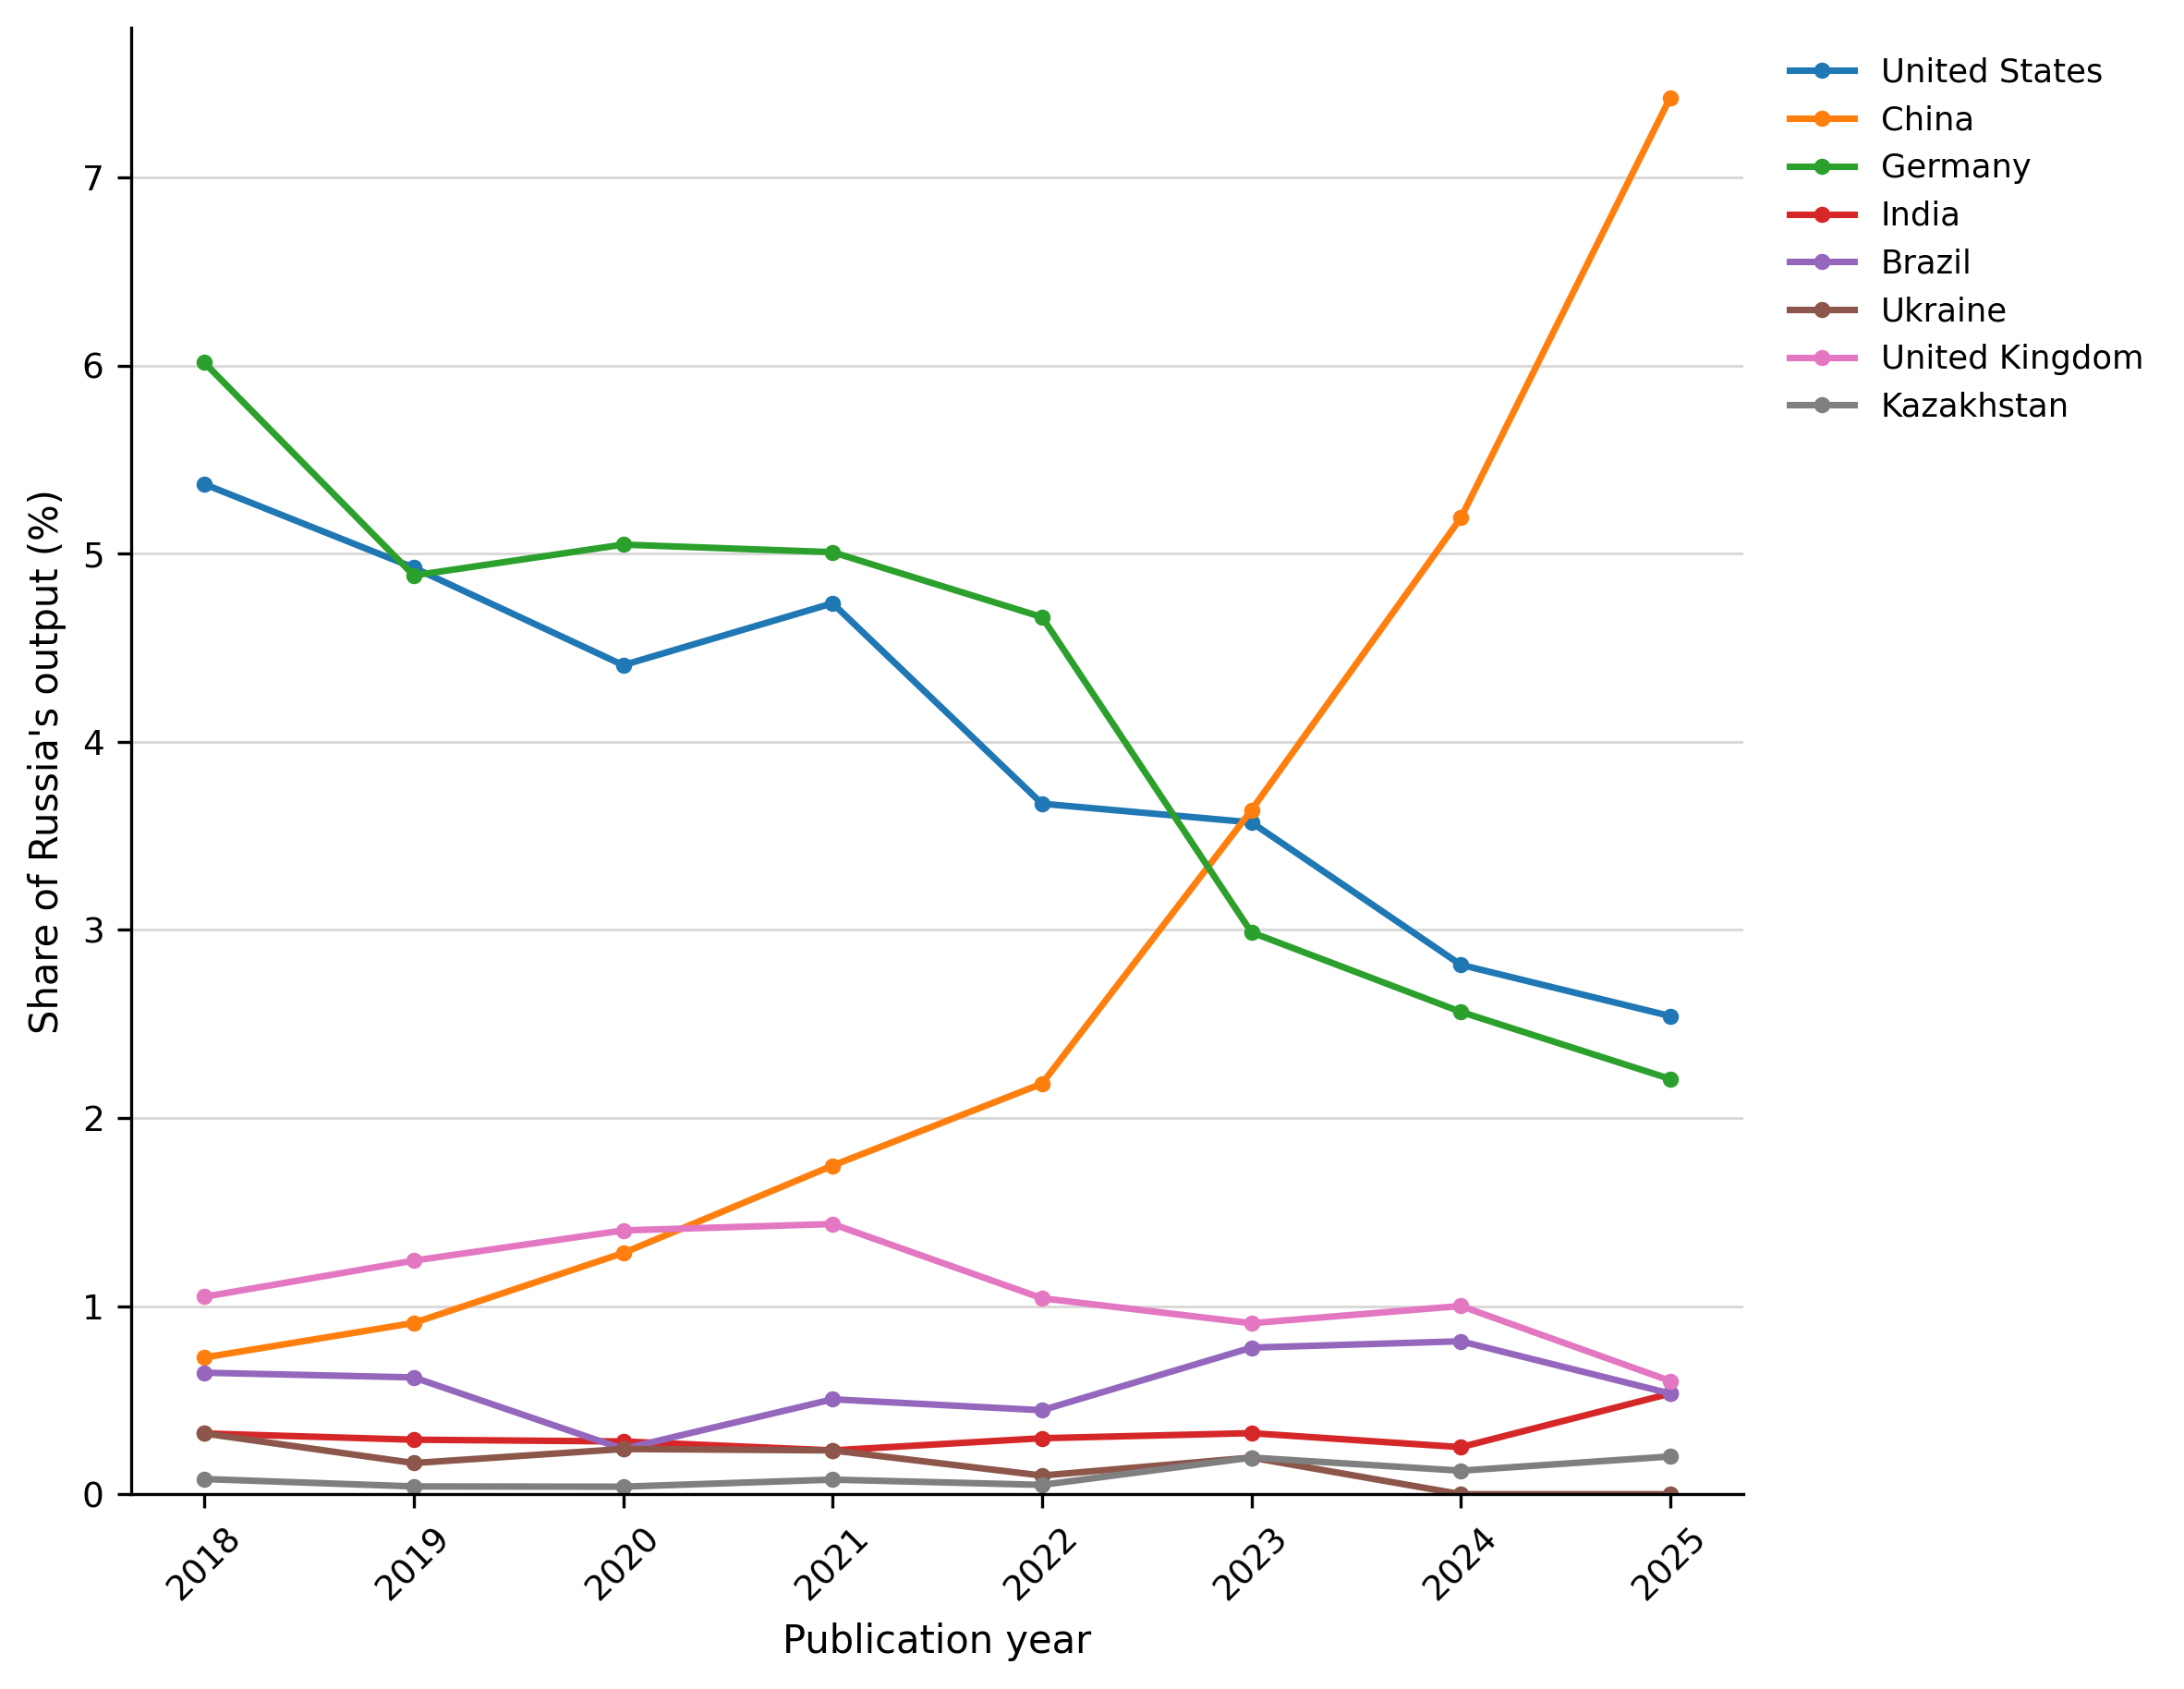
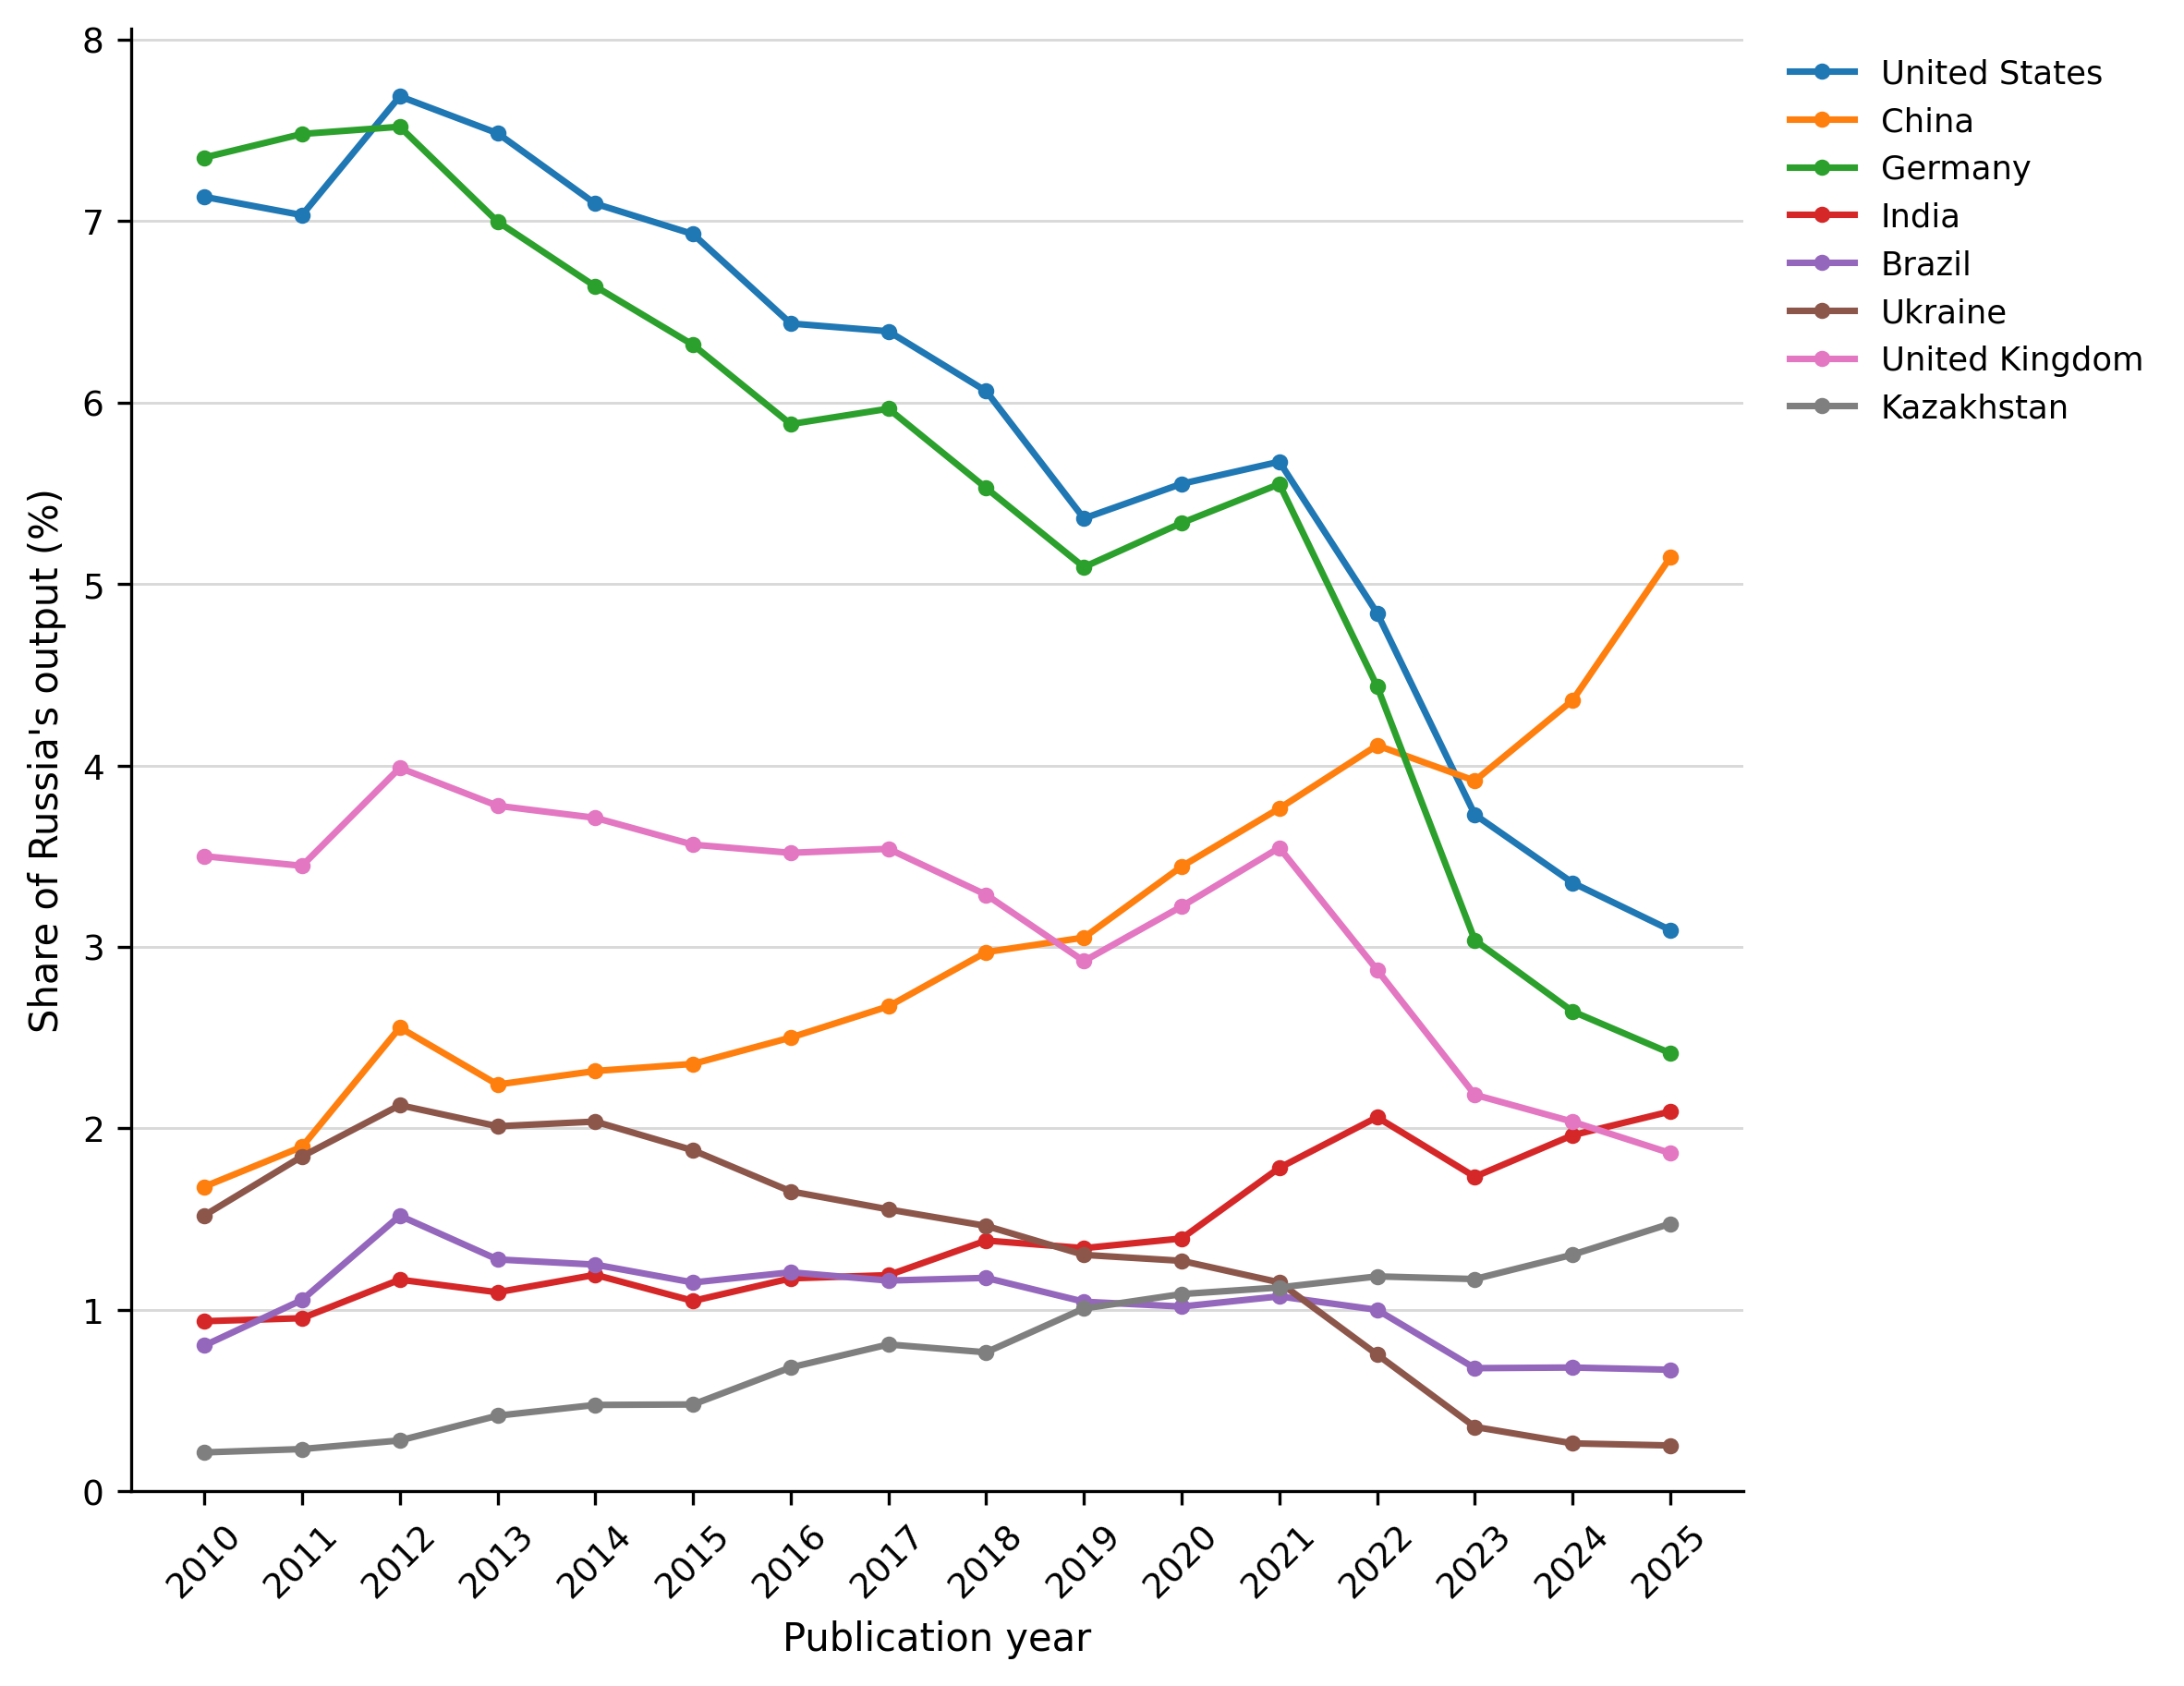
Interestingly, when we plot papers as share of Russia's total output, the trend with USA and Germany reverses into a smooth linear decrease without any 2022 shock, with a (COVID-related?) bump instead.
Figure 6. Publications with selected countries as percentages of Russia's total output, 2010–2025. For each partner and year, the joint paper count is divided by all Russia-affiliated papers in the same year and multiplied by 100.
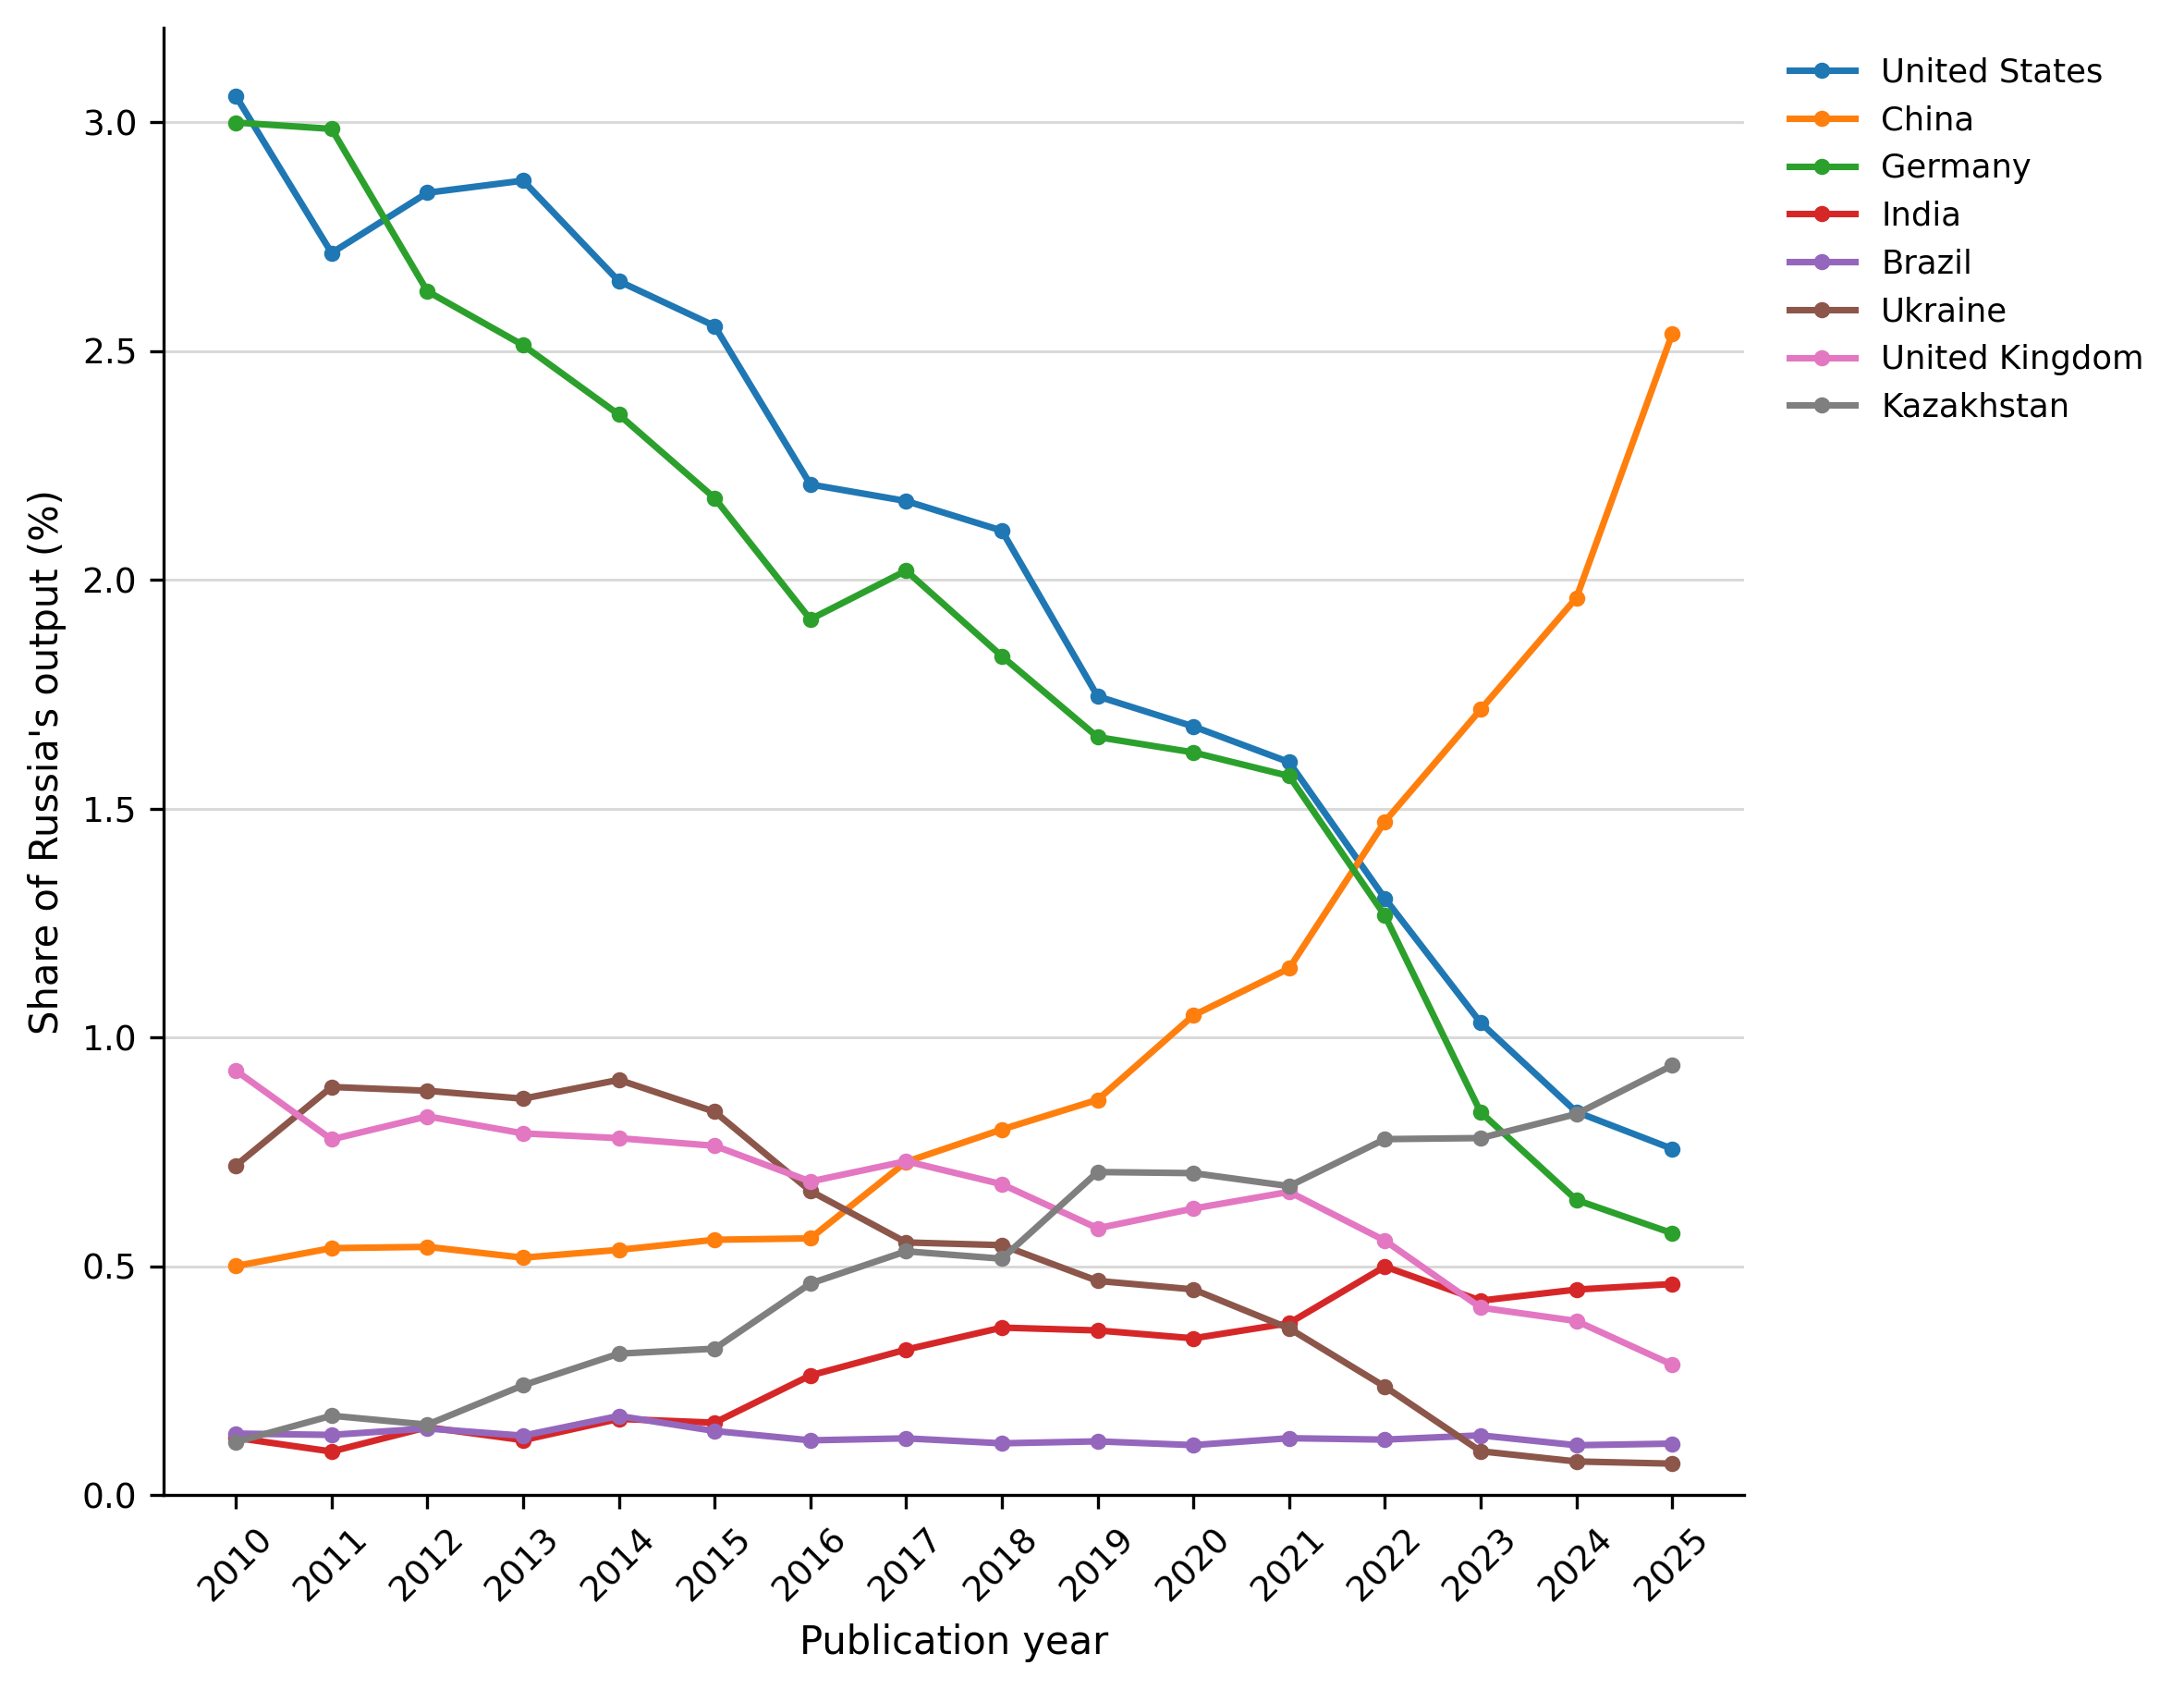
Because their counts are small, relative importance of strictly bilateral papers is low. Such papers are more important as indicators, highlighting the orientation towards China, and different project configuration (e.g. Kazakhstan compared to USA, UK and Germany). Again, the trend accelerates in 2022.
Figure 7. Strictly bilateral publications with selected partner countries as percentages of Russia's total output, 2010–2025. For each partner and year, the strictly bilateral paper count is divided by all Russia-affiliated papers in the same year and multiplied by 100.
Before we proceed to collaboration metrics for Russia's NI papers, it is important to note the growing share of such papers written without any international partners at all, reaching one in three in 2025. And this is extremely uneven for different fields: almost zero for Biology and >40% for Chemistry.
Figure 8a. Russia-only papers as % of Russia's NI papers, 2018–2025.
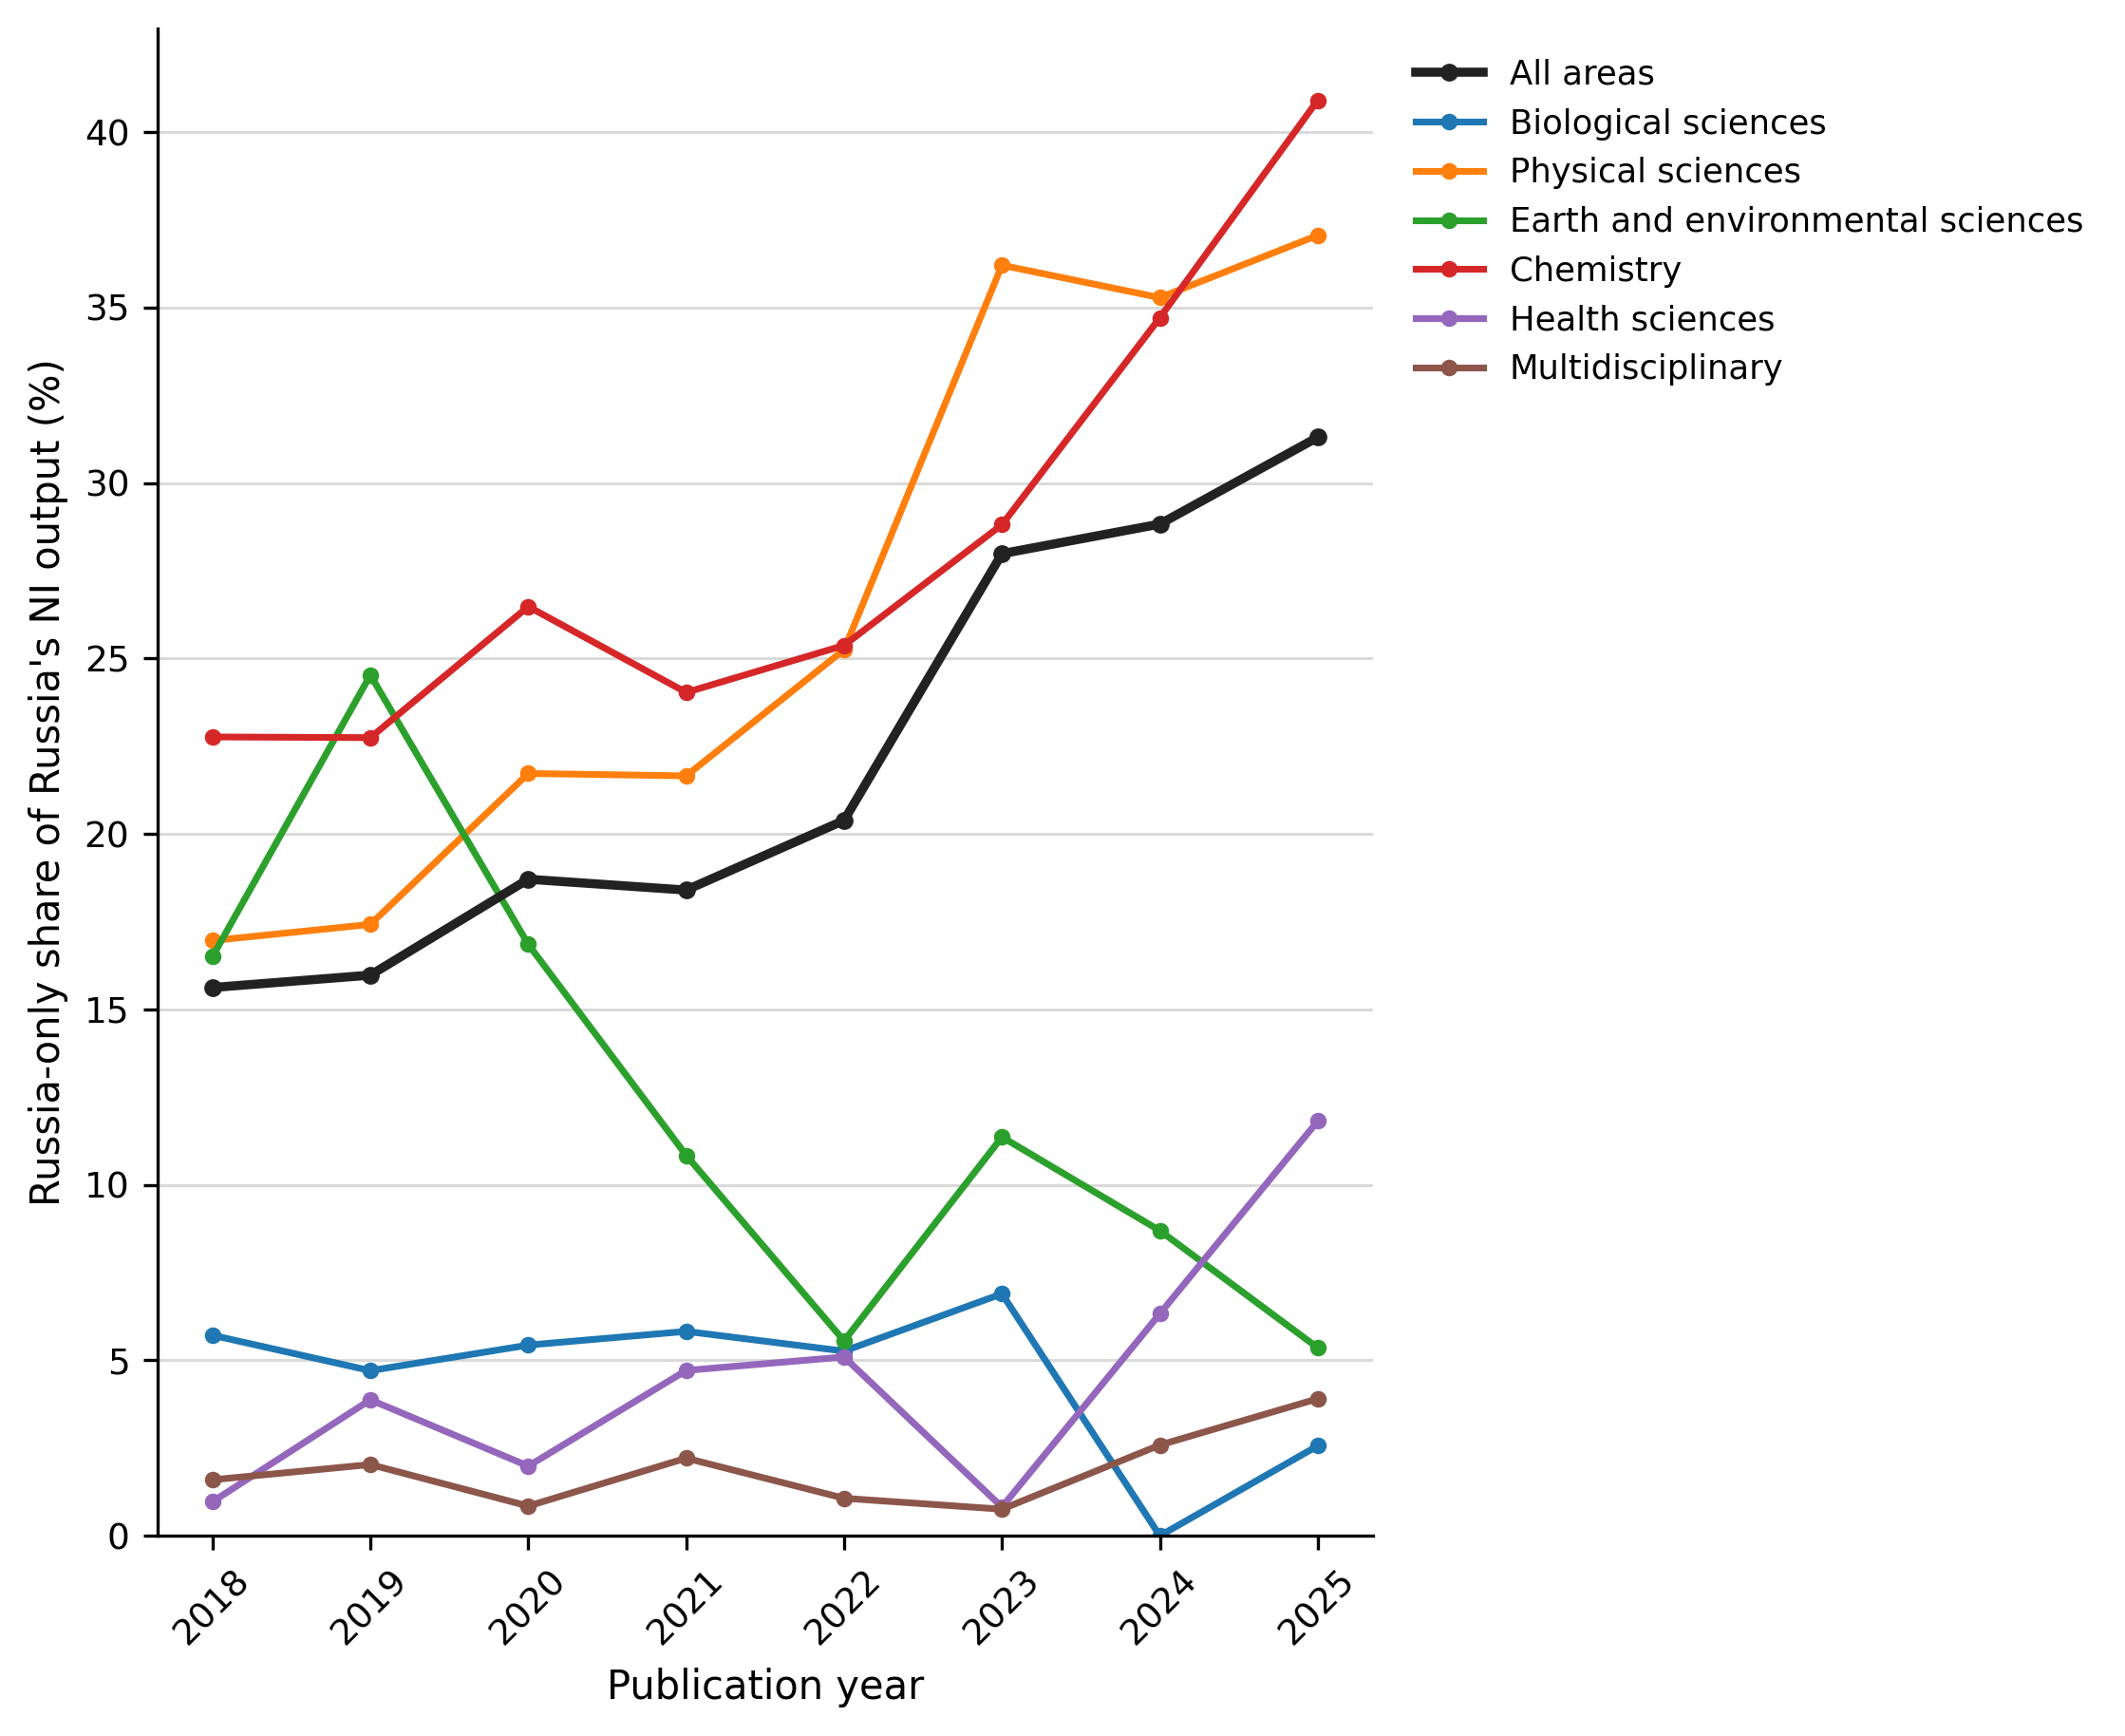
Figure 8. Publication counts between Russia and selected countries in Nature Index journals, 2018–2025.
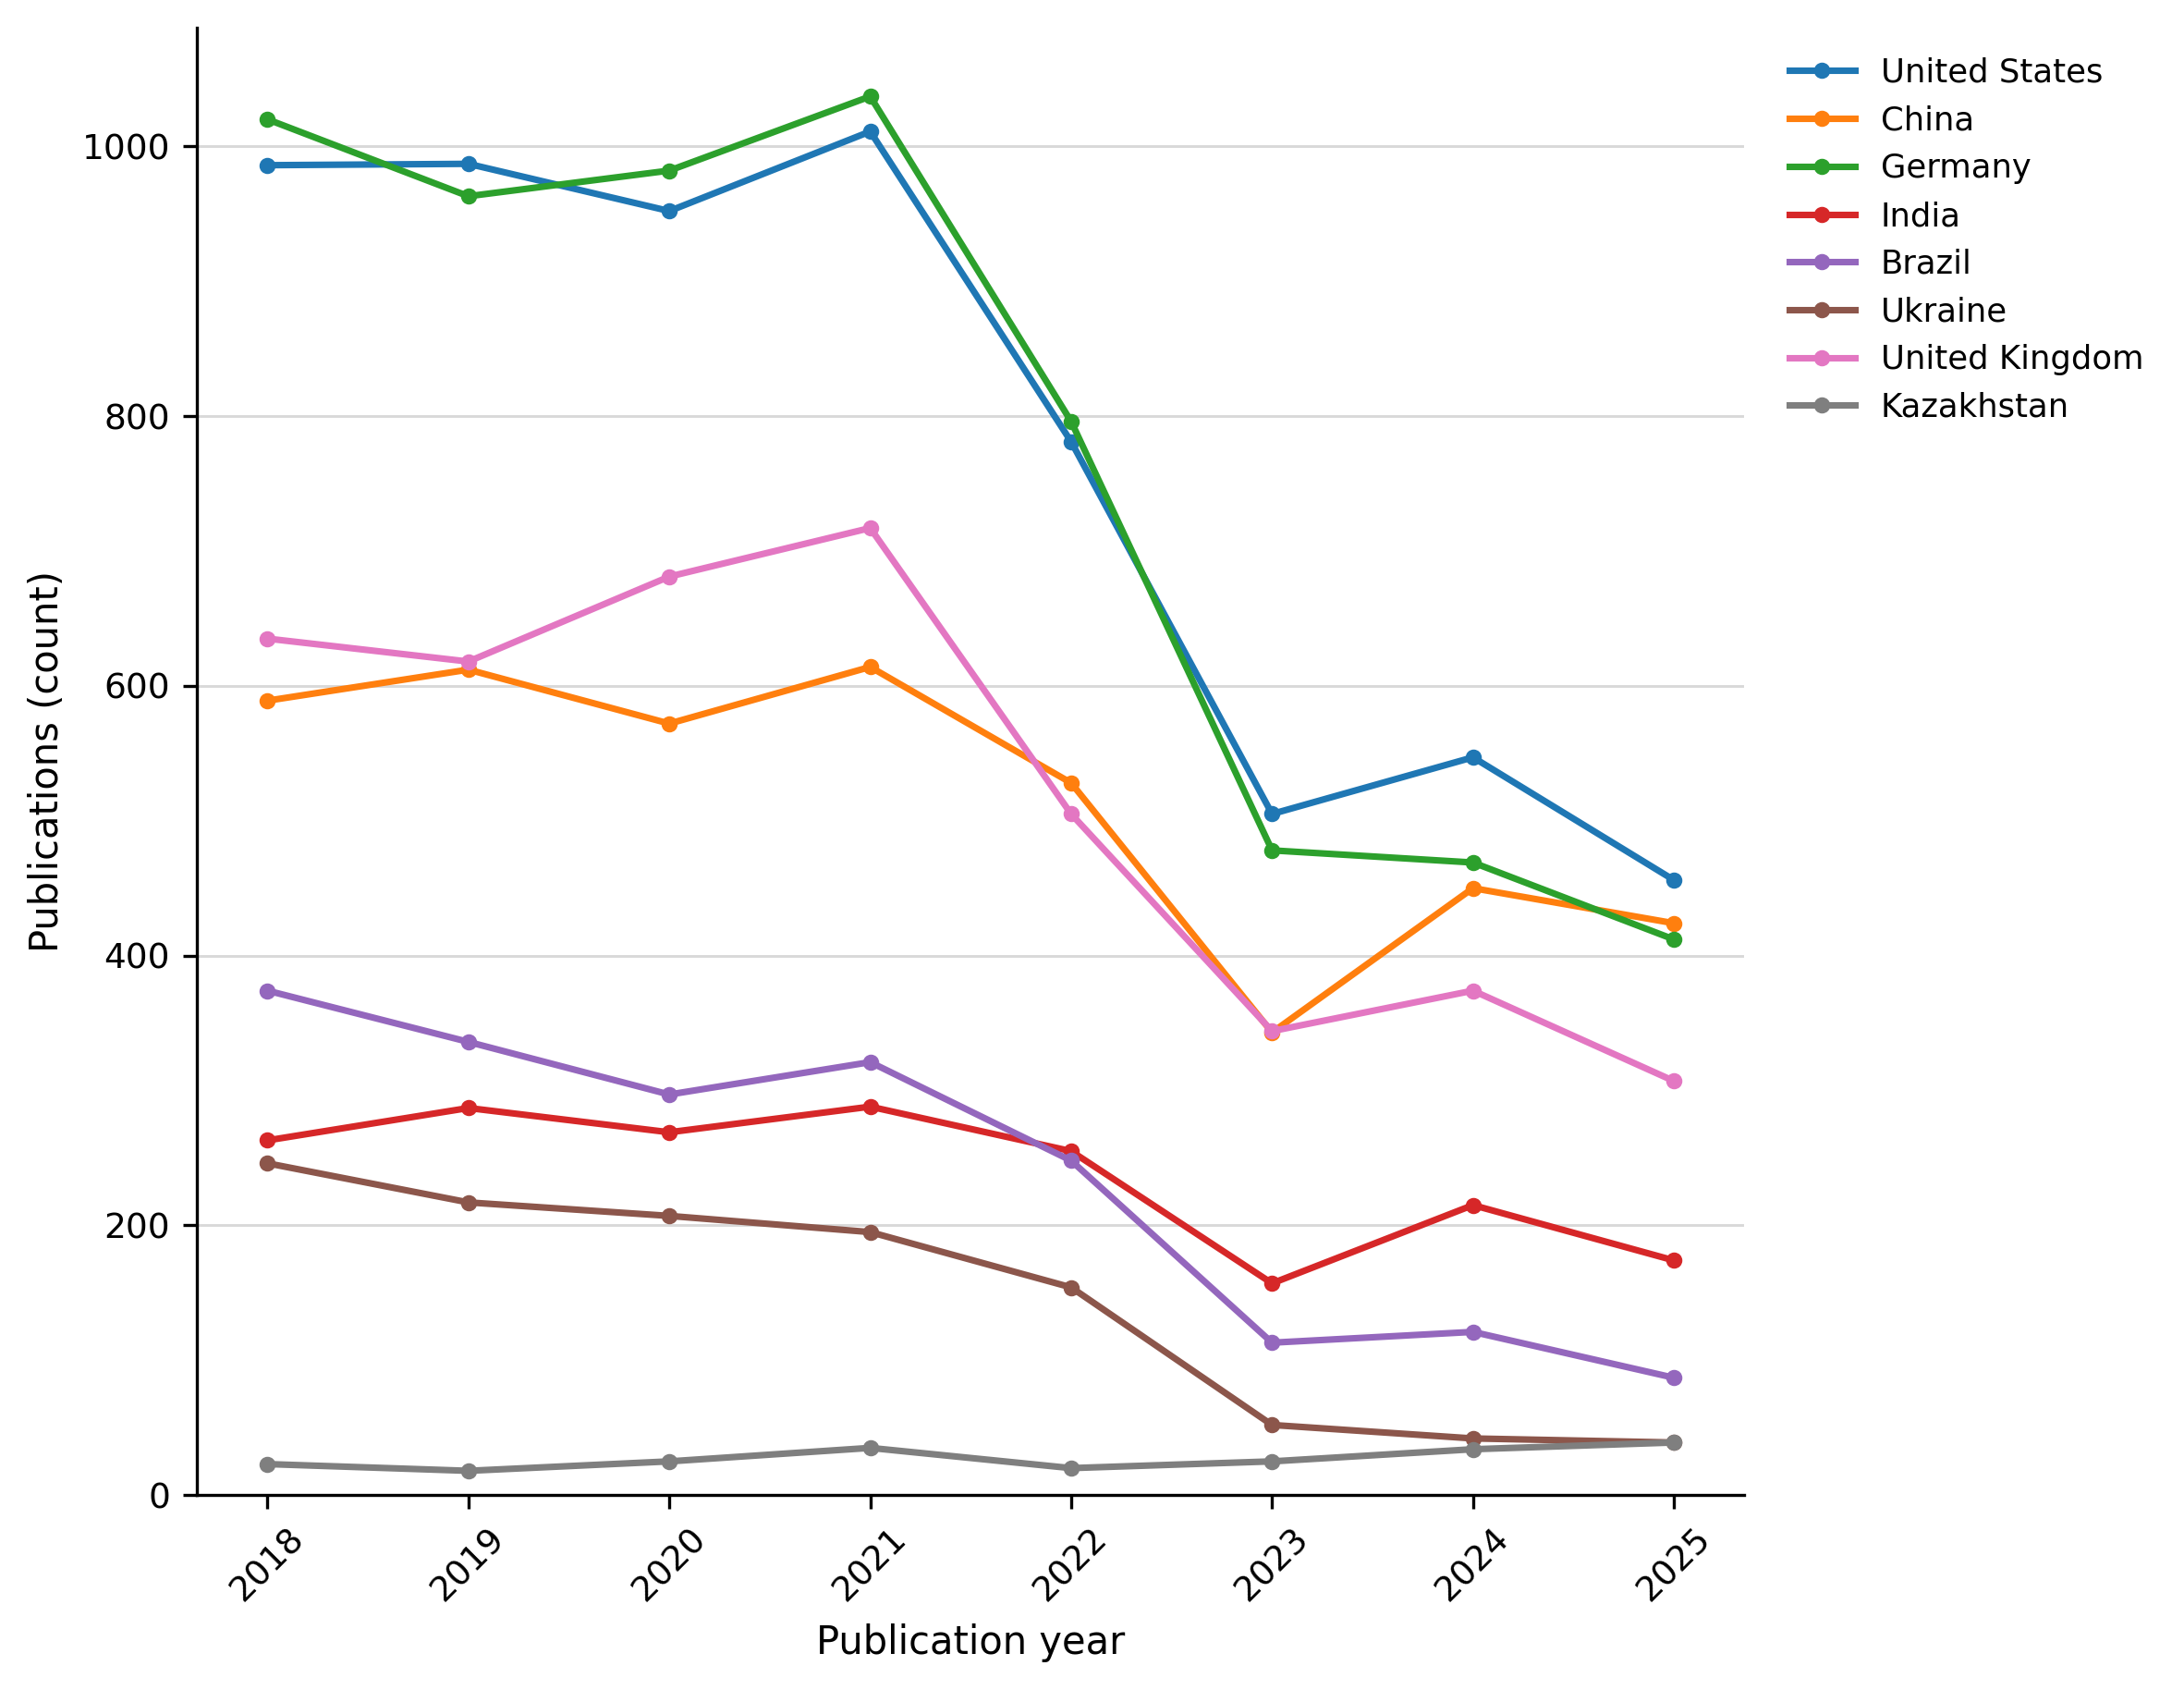
Figure 9. Strictly bilateral publication counts between Russia and selected countries in Nature Index journals, 2018–2025.
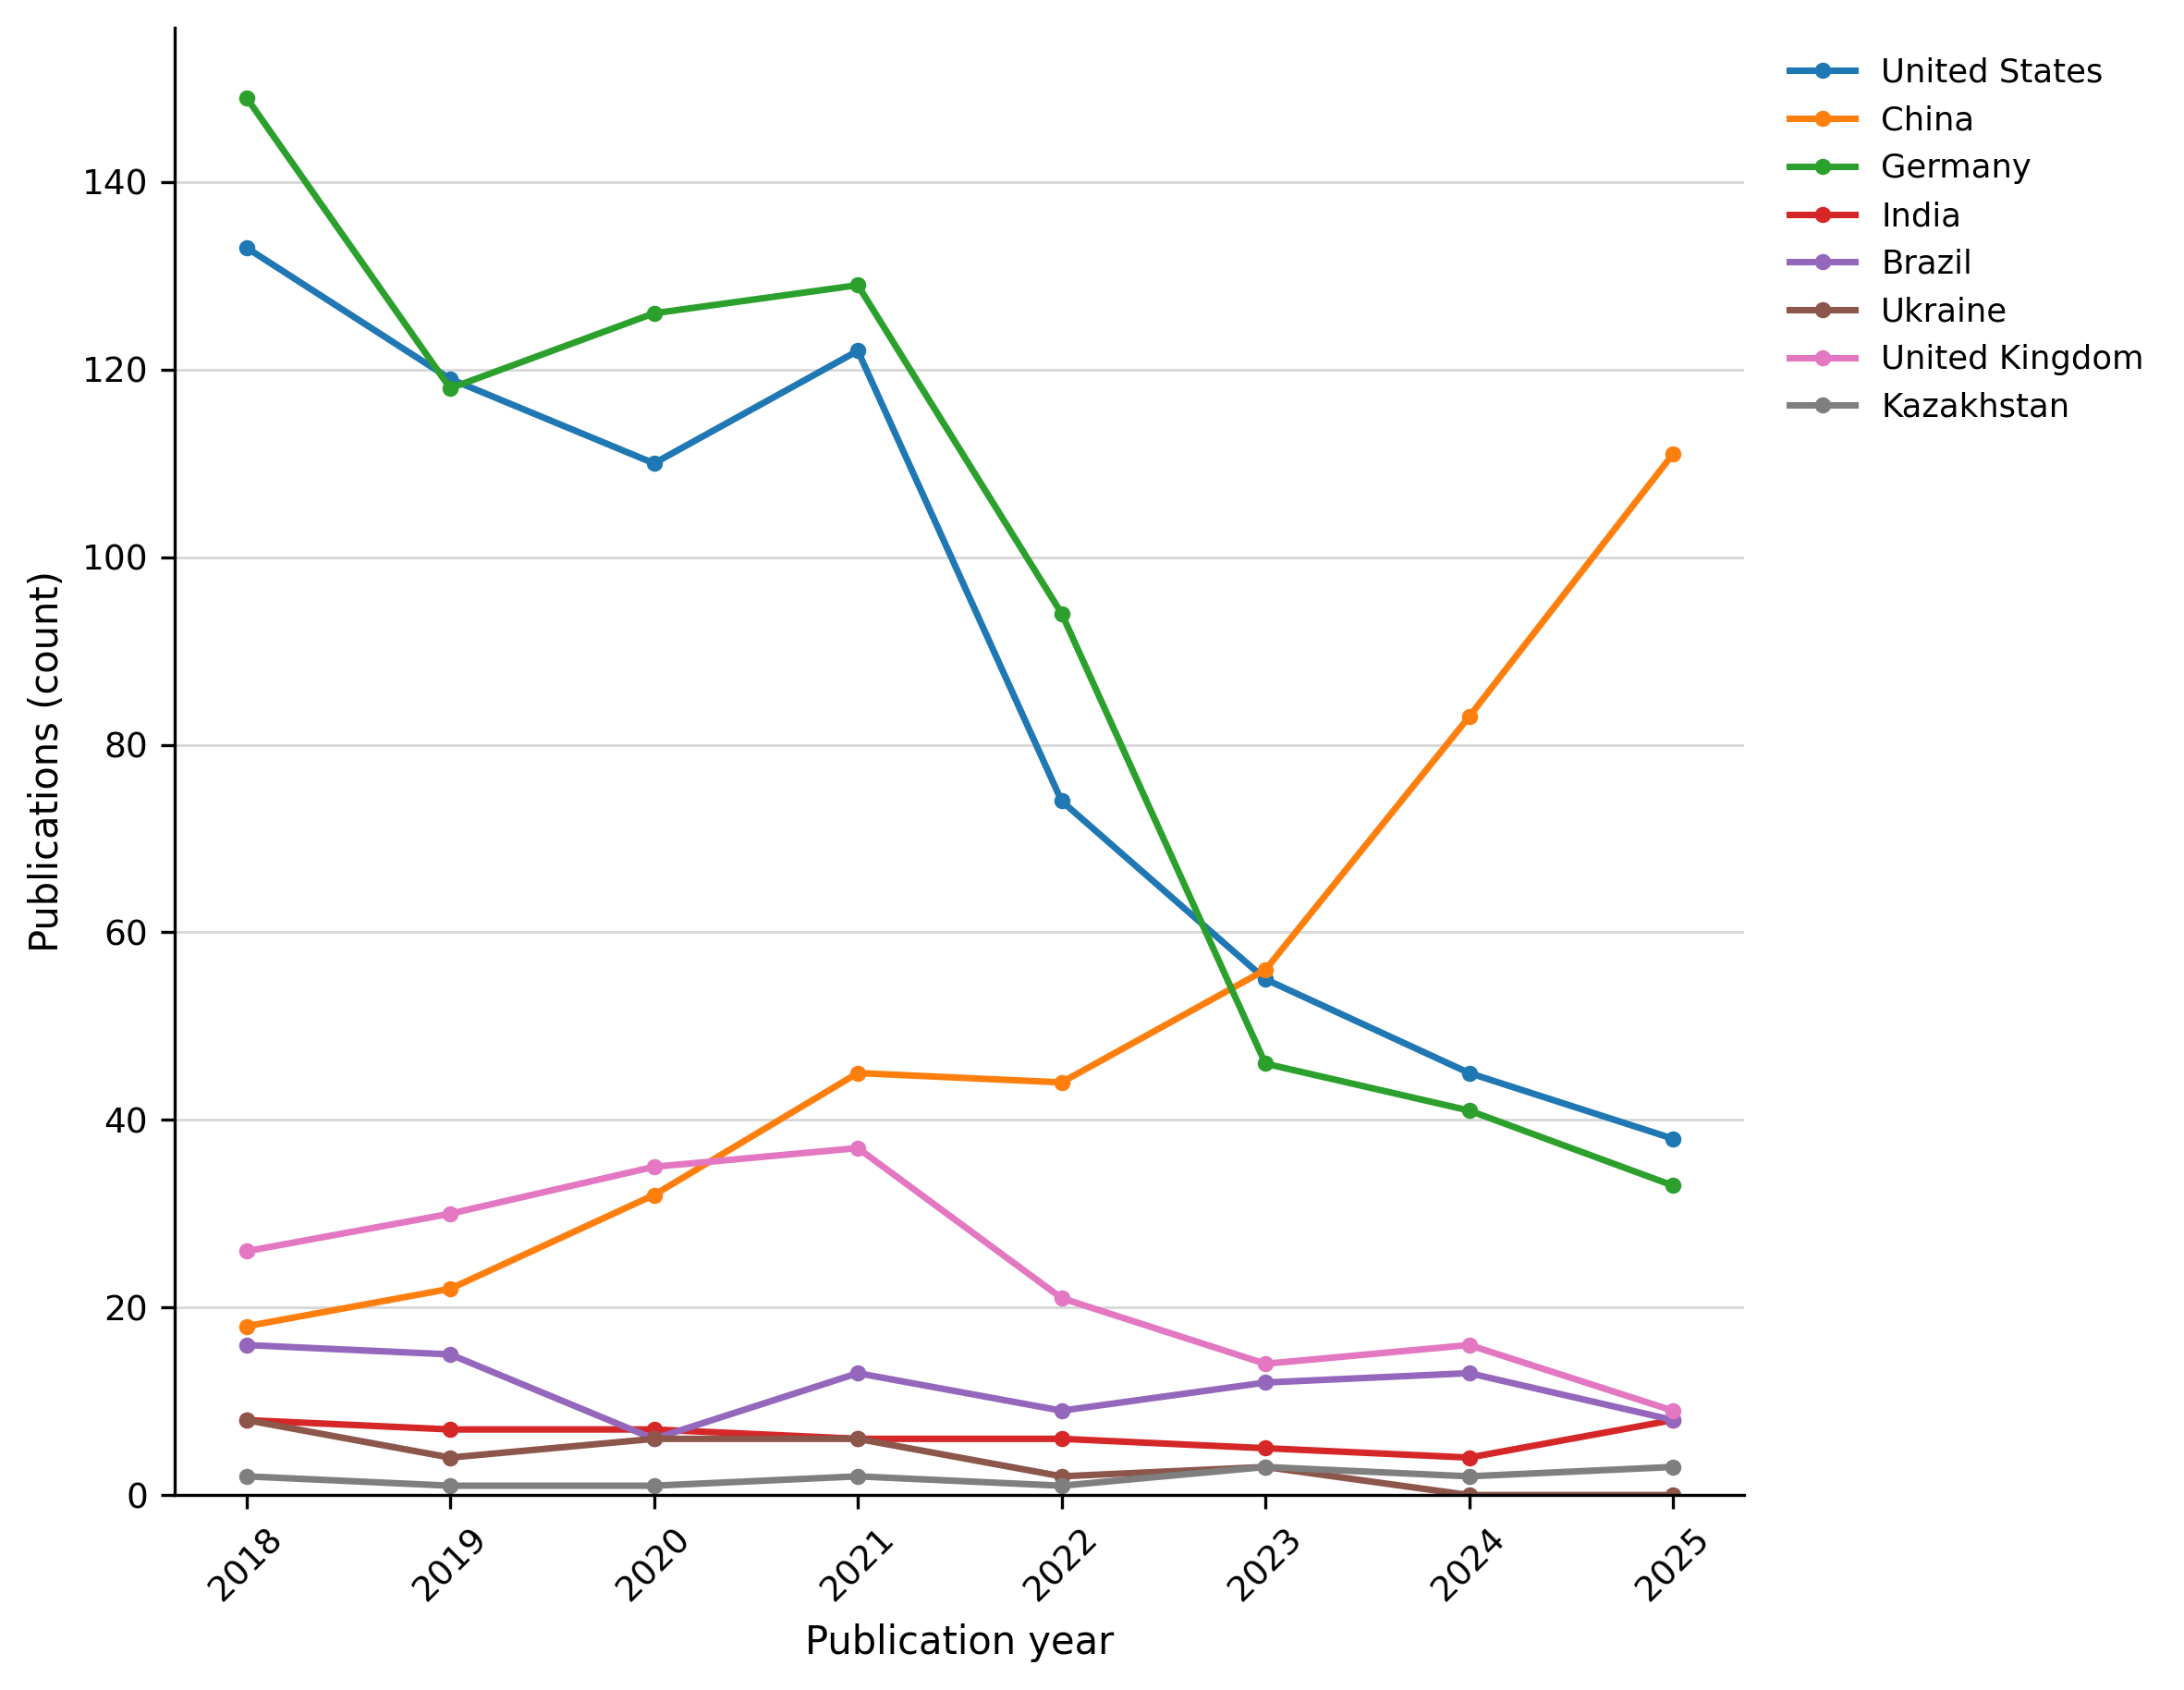
Figure 10. Publications with selected countries as percentages of Russia's Nature Index-journal output, 2018–2025.
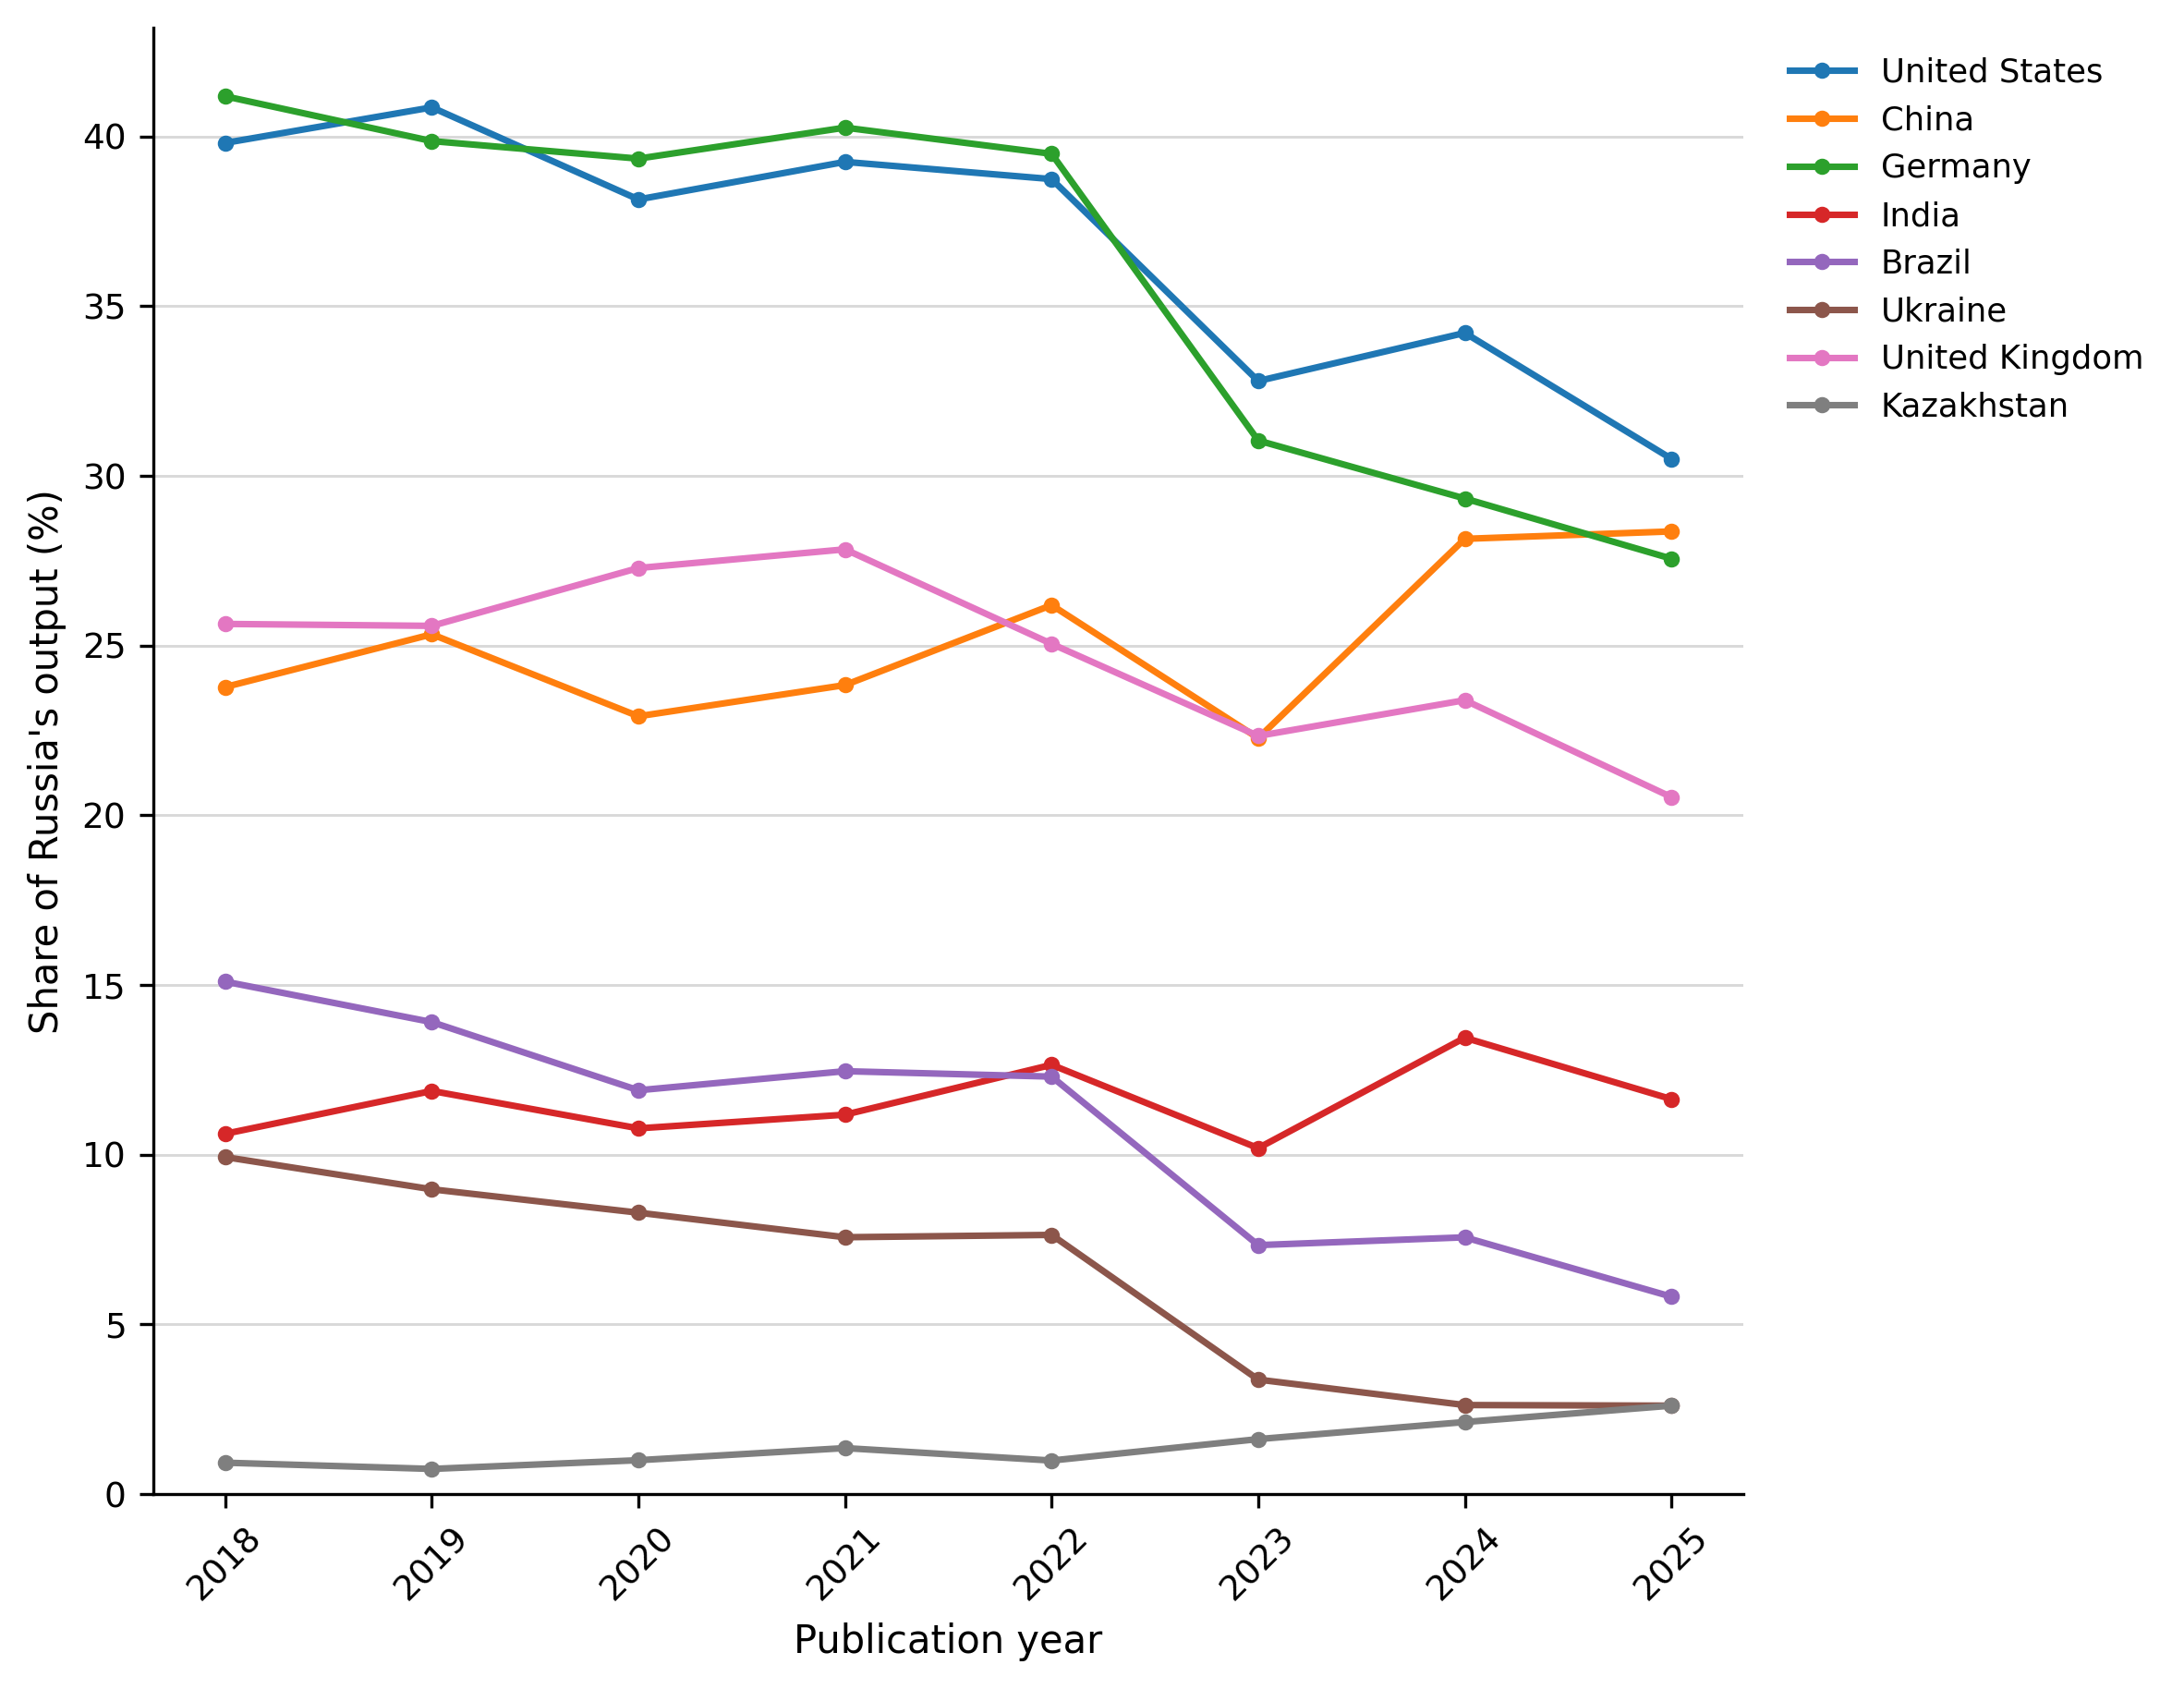
Figure 11. Strictly bilateral publications with selected countries as percentages of Russia's Nature Index-journal output, 2018–2025.