Russian qualifying degrees in US green-card sponsorship, FY2015–2024
Report of 2026-11-03. Data: US Department of Labor (DOL) PERM disclosure files. I match 90% of the raw organization strings to ROR using the advanced matcher I built for my work at E-Quadrat. This is a section on Russian degrees, all numbers were computed after every leftover unmatched Russian institution name was matched by Opus 5.5 high (see "Method").
What this report asks
PERM ("Program Electronic Review Management") is the labour certification a US employer needs before it can sponsor a foreign worker for a green card (permanent residence) in the employment-based second and third preference categories (EB-2 and EB-3). From fiscal year (FY) 2015, each PERM case names the institution where the worker earned the qualifying degree, which is the degree that qualifies them for the job, usually their highest. A US fiscal year runs from 1 October to 30 September and is named after the year in which it ends.
This report takes one country, Russia, and asks what the PERM data say about people whose qualifying degree is from a Russian institution:
- How many are there, and how did that change?
- Which universities trained them?
- Which US employers sponsor them, and how concentrated is that?
- What wages are they offered?
- In which occupations, industries, degree fields and US states do they work?
- Is there a break after February 2022?
The main comparison is FY2015–17 against FY2021–23, as averages per year. FY2024 is shown but left out of averages, because its file holds only the cases filed on the old form (a new form without the institution field took over in 2023). Germany, all non-US degrees and US degrees are the reference groups, so that each Russian number has a point of comparison.
The short answer
- Russian-degree cases fell from 499 to 315 a year (−37%). German-degree cases fell by the same proportion (294 → 184, −37%). Most of the fall is the study-wide shift of qualifying degrees towards US universities, not a collapse specific to Russia.
- The sponsors changed. Big Tech firms (Microsoft, Google, Amazon, Meta, Intel) sponsored far fewer Russian-degree holders. IT-services firms that had large engineering centres in Russia (EPAM, Luxoft, Grid Dynamics) sponsored more, mostly by transferring their own staff (L-1 visas). EPAM became the largest single sponsor.
- Sponsorship is concentrated. The ten largest employers hold 30–36% of Russian-degree cases, against about 20% for non-US degrees as a whole.
- Offered wages fell relative to others. The median offer (in FY2024 dollars) went from $143,100 to $129,500. It was about $14,000 above the median for all non-US degrees in FY2015–17 and level with it in FY2021–23. About a third of the fall comes from the employer shift from high-paying Big Tech to IT-services firms.
- The work is computing. About 70% are in computer and mathematical occupations, three-quarters hold a master's-level degree, and Russian degrees in mathematics and physics are far more common than for other countries.
- No break after February 2022 is visible. The decline started in 2021, and Germany declined in parallel. Smaller changes after 2022 do appear: more people filed while on visitor visas or from outside the US, and the IT-services firms with Russian centres almost stopped sponsoring.
1. How many
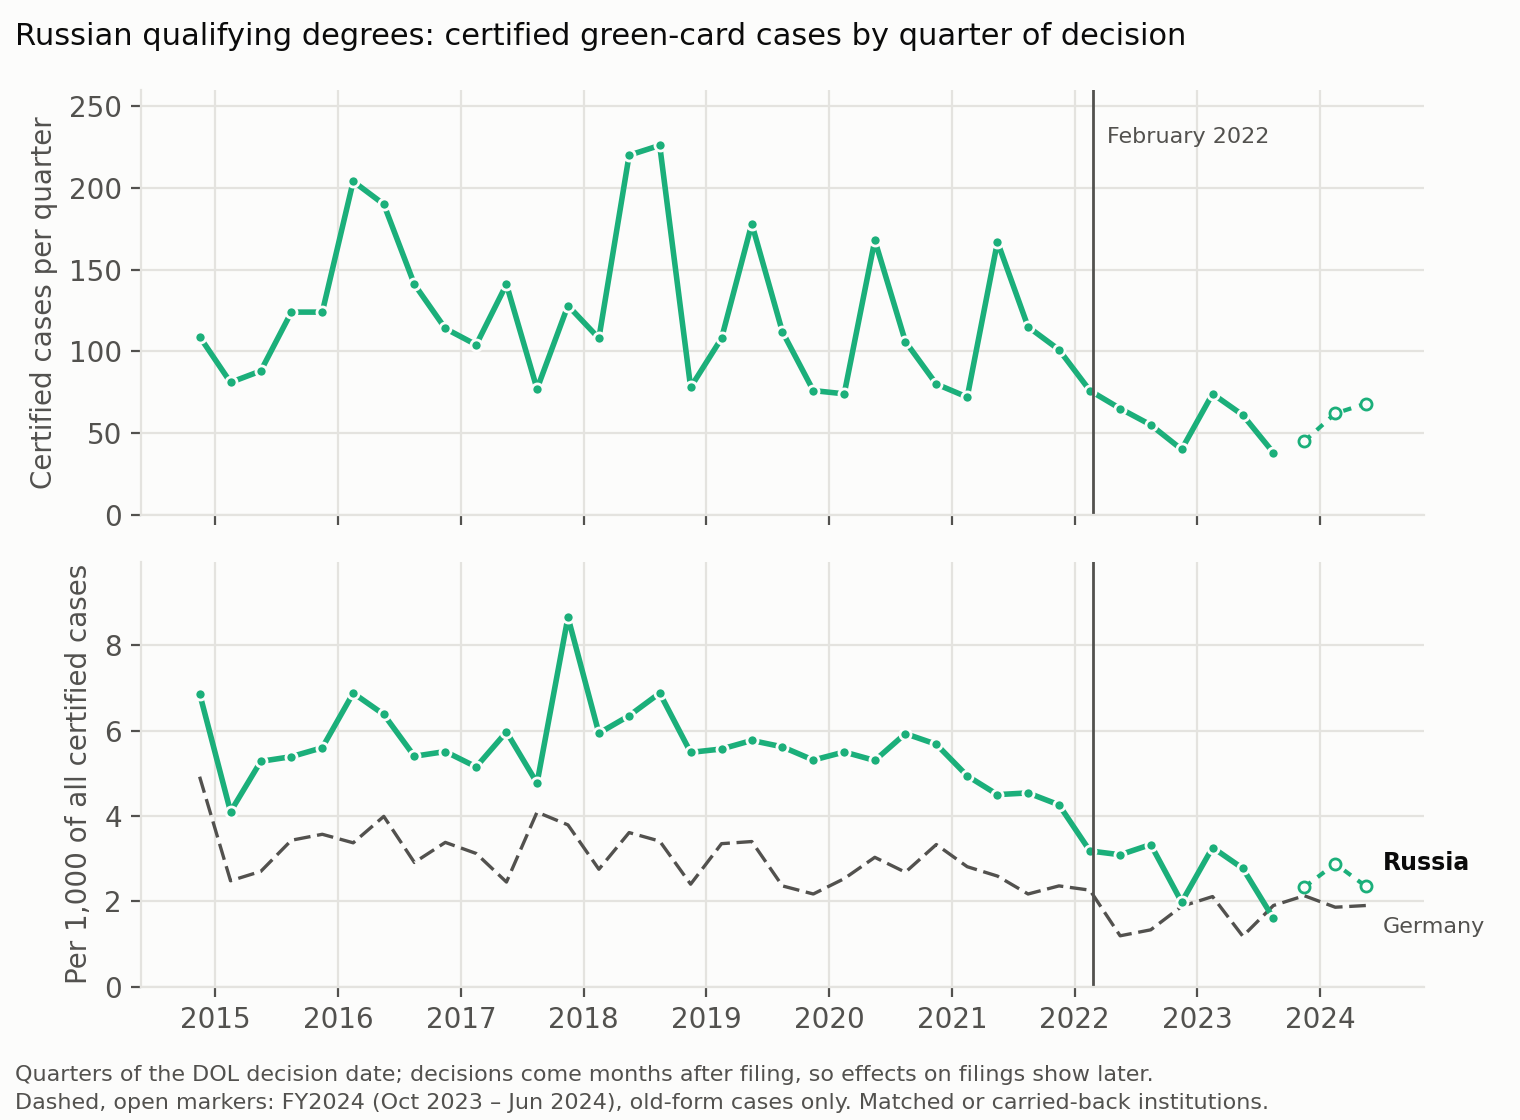
Upper panel: certified cases per calendar quarter of the DOL decision date. Lower panel: the same per 1,000 of all certified cases, which removes the large swings in how many cases DOL decides each quarter; the dashed grey line is Germany. The vertical line marks February 2022. FY2024 (open markers) holds old-form cases only.
| Fiscal year | Russian-degree cases | Per 1,000 certified | German-degree cases | Per 1,000 certified |
|---|---|---|---|---|
| 2015 | 402 | 5.3 | 251 | 3.3 |
| 2016 | 659 | 6.1 | 374 | 3.5 |
| 2017 | 436 | 5.4 | 257 | 3.2 |
| 2018 | 682 | 6.8 | 343 | 3.4 |
| 2019 | 476 | 5.6 | 251 | 3.0 |
| 2020 | 424 | 5.5 | 209 | 2.7 |
| 2021 | 434 | 4.8 | 239 | 2.6 |
| 2022 | 297 | 3.5 | 157 | 1.8 |
| 2023 | 213 | 2.4 | 157 | 1.8 |
| 2024 (partial) | 177 | 2.5 | 138 | 1.9 |
| Per year, FY2015–17 → FY2021–23 | 499 → 315 (−37%) | 294 → 184 (−37%) |
The yearly counts swing with DOL's processing volume (FY2016 and FY2018 were heavy years for all countries), so the rate per 1,000 is the better guide. The Russian rate was steady at about 5–7 per 1,000 until 2020 and then fell to about 2.5.
Who these people are. 87–89% are Russian citizens; the rest are mainly Canadian, Israeli, Ukrainian, Belarusian and Kazakh citizens with a Russian degree. The other side of the coin: Russian citizens whose qualifying degree is from a US university held steady at 98–147 a year in FY2015–23 (about 117 on average). So fewer Russian citizens enter green-card sponsorship with a Russian degree, while the number entering with a US degree did not change.
2. Which universities
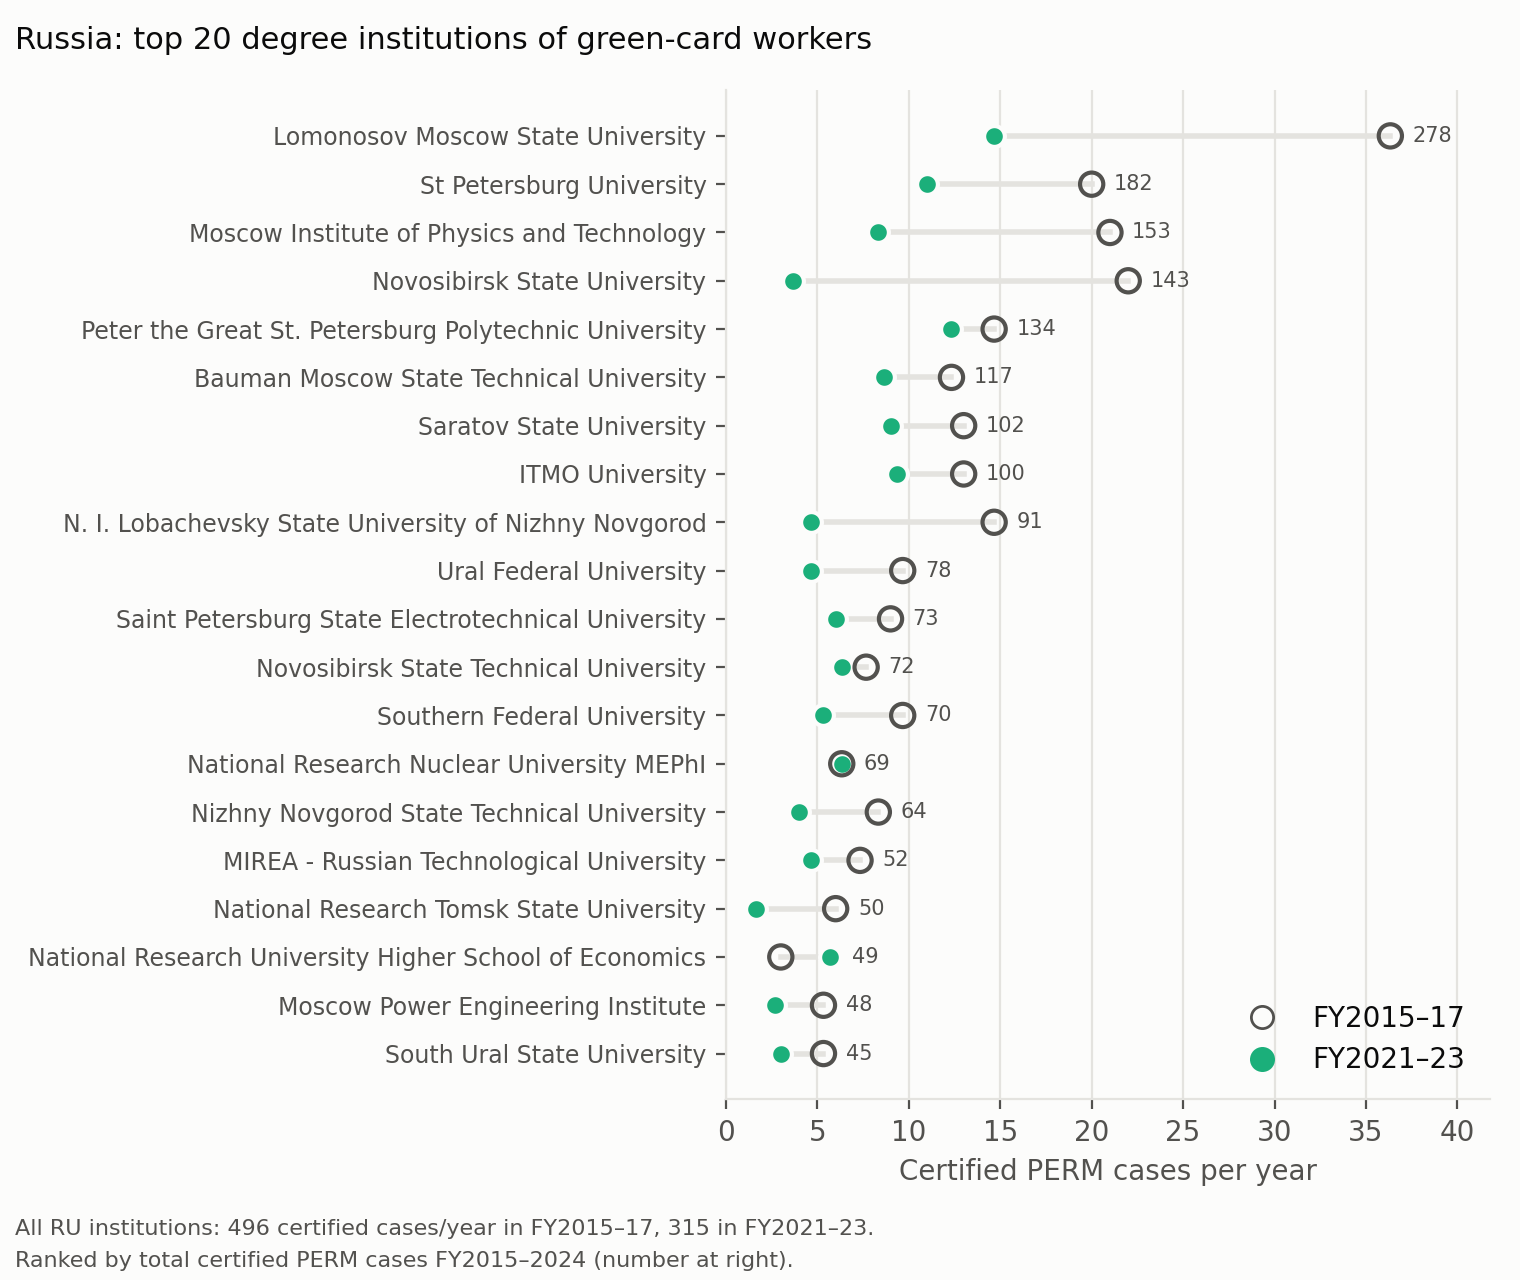
Hollow ring: FY2015–17; filled dot: FY2021–23. The number at the right is the total over FY2015–2024.
| University | Cases, FY2015–24 | Per year, FY2015–17 → FY2021–23 | Computer occupations | Median offer (FY2024 $) | Largest sponsor |
|---|---|---|---|---|---|
| Lomonosov Moscow State University | 278 | 36 → 15 | 71% | 151,000 | Microsoft (30) |
| St Petersburg University | 182 | 20 → 11 | 82% | 151,300 | Oracle (24) |
| Moscow Institute of Physics and Technology (MIPT) | 153 | 21 → 8 | 82% | 154,800 | Intel (11) |
| Novosibirsk State University | 143 | 22 → 4 | 85% | 150,000 | Intel (32) |
| Peter the Great St Petersburg Polytechnic | 134 | 15 → 12 | 84% | 135,400 | EPAM (26) |
| Bauman Moscow State Technical University | 117 | 12 → 9 | 79% | 141,000 | Microsoft (16) |
| Saratov State University | 102 | 13 → 9 | 90% | 148,300 | Grid Dynamics (22) |
| ITMO University | 100 | 13 → 9 | 92% | 139,000 | Grid Dynamics (11) |
| Lobachevsky University of Nizhny Novgorod | 91 | 15 → 5 | 91% | 154,800 | Five9 (13) |
| Higher School of Economics (HSE) | 49 | 3.0 → 5.7 | 45% | 135,900 | Google (8) |
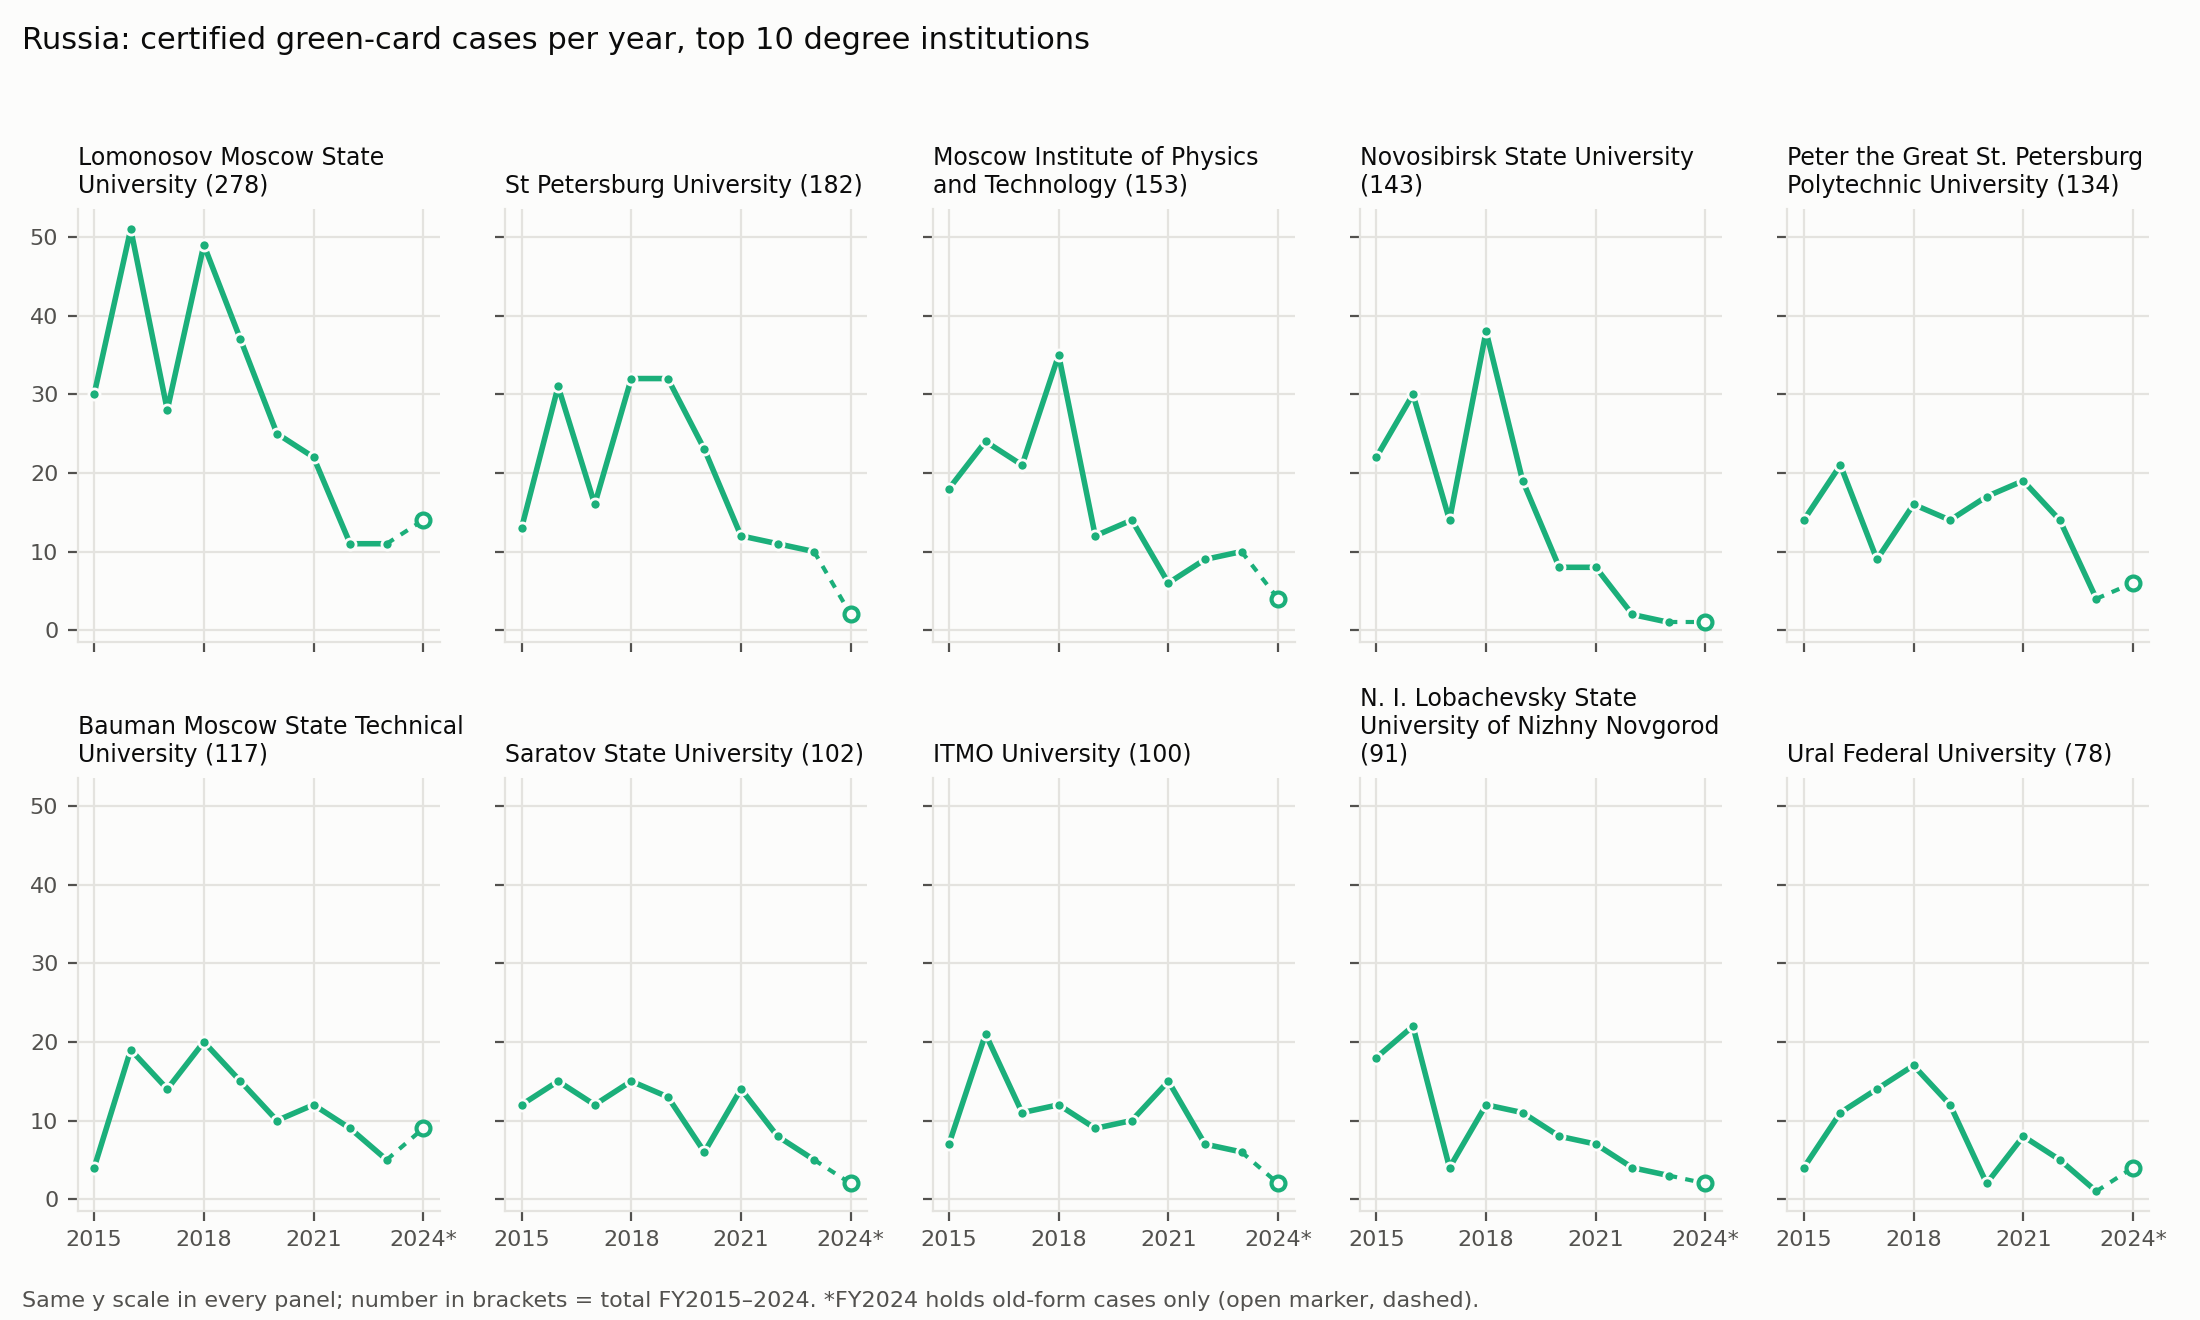
- Every large university fell, Novosibirsk State most steeply. HSE is the only sizeable one that grew, and it is also the least computing-oriented (a third bachelor's degrees, many business and economics graduates).
- Some universities feed one employer: Novosibirsk State → Intel (Intel had a development centre in Novosibirsk; general knowledge, not from the data), Saratov State → Grid Dynamics, Tomsk State → F5 Networks (28 of its 50 cases). This looks like a pipeline from a local university to a US firm's engineering office in the same city, and then by transfer to the US.
- Median offers lie between about $113,000 and $155,000 at every university with at least 30 cases; they do not separate the universities clearly.
3. Which employers
| Employer | Per year, FY2015–17 → FY2021–23 | Share of Russian cases |
|---|---|---|
| EPAM Systems | 17 → 33 | 3.5% → 10.6% |
| Microsoft | 32 → 8 | 6.5% → 2.6% |
| 24 → 7 | 4.9% → 2.2% | |
| Luxoft | 15 → 18 | 2.9% → 5.7% |
| Intel | 11 → 3 | 2.1% → 1.0% |
| Amazon (all units) | 19 → 10 | 3.7% → 3.2% |
| Grid Dynamics | 4 → 16 | 0.7% → 5.2% |
| Meta / Facebook | 13 → 4 | 2.5% → 1.2% |
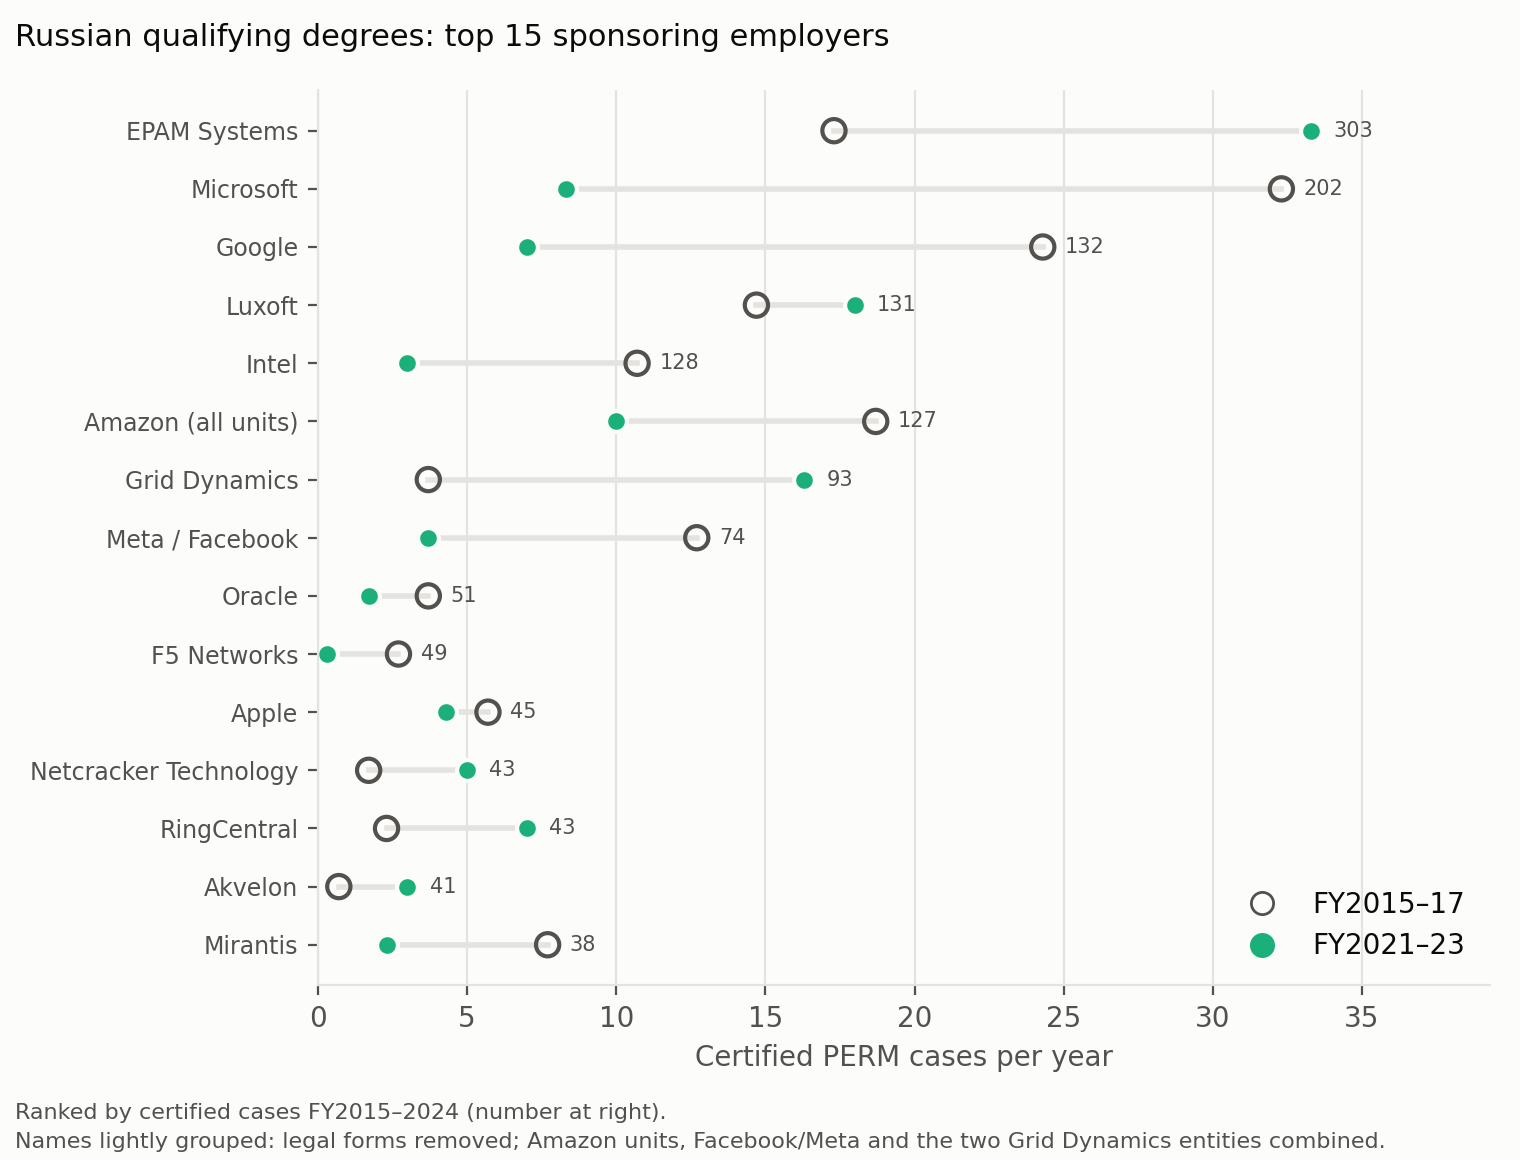
Employer names are grouped lightly: legal forms (Inc., LLC, Corp.) removed, Amazon's units combined, Facebook and Meta combined (it was renamed in 2021), and Grid Dynamics' two legal entities combined.
Two channels. The data show two different ways Russian-degree holders reach a green card:
- Big Tech hiring. Microsoft, Google, Amazon, Meta, Apple and Intel together held 21% of Russian cases in FY2015–17 and 12% in FY2021–23.
- Transfers within IT-services firms. EPAM, Luxoft, Grid Dynamics, Netcracker and Mirantis had large engineering centres in Russia before 2022 (this is general knowledge, not something the data show). Their share rose from 9% to 24%. From FY2016 on, 73–89% of their Russian-degree cases each year were filed while the worker held an L-1 visa, the visa for transferring an existing employee from a foreign office of the same company. The work-site state shows the same thing: Pennsylvania, where EPAM has its US headquarters, went from 2.5% to 11.7% of Russian cases.
Concentration. The ten largest employers hold 30.1% of Russian-degree cases in FY2015–17 and 35.9% in FY2021–23. For Germany the figures are 18.9% → 25.3%, for all non-US degrees about 20% in both periods. The Herfindahl–Hirschman index (HHI, the sum of squared employer shares × 10,000; a standard concentration measure, higher = more concentrated) rose from 130 to 220 for Russia, against 69 → 99 for Germany. About 78% of the employers that sponsor a Russian-degree holder do so only once in a period; the concentration comes from a few large sponsors.
4. What wages
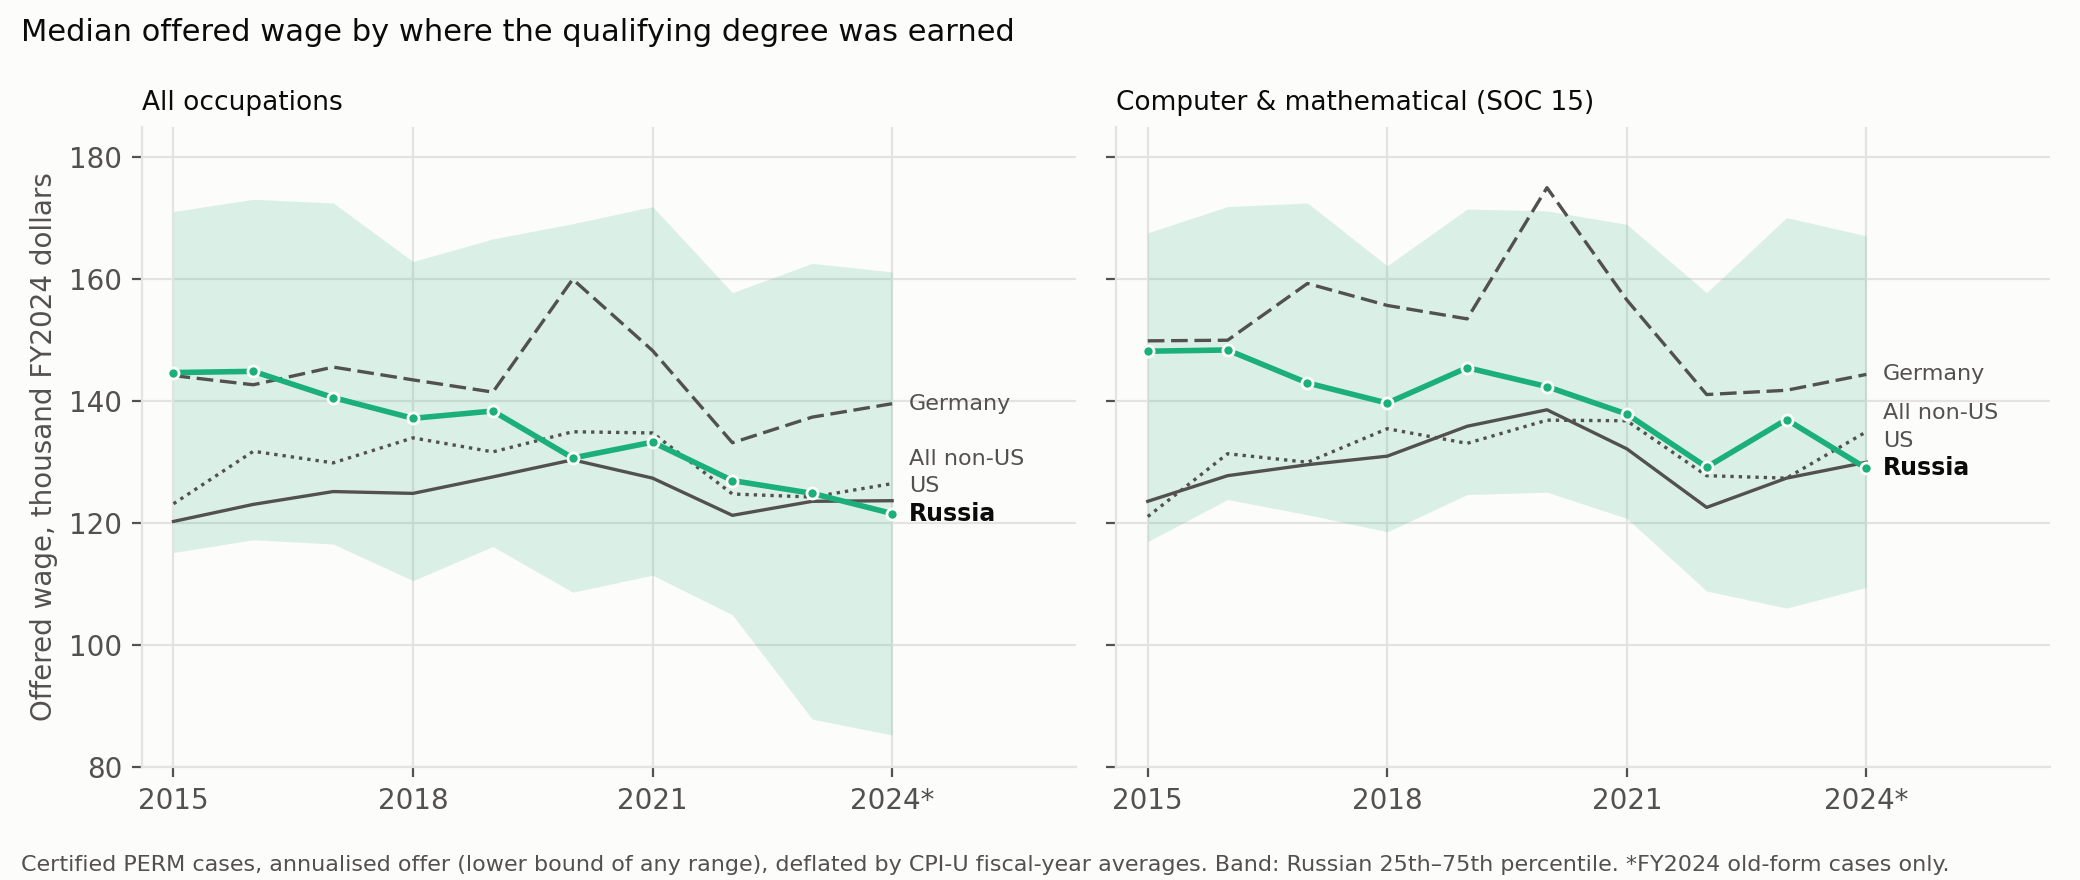
The wage is the employer's offer for the sponsored job (the lower bound if a range is given), converted to a yearly amount and to FY2024 dollars with the US consumer price index (CPI-U, fiscal-year averages). The shaded band is the middle half (25th to 75th percentile) of Russian offers.
Median offered wage, FY2024 dollars:
| Group | All occupations, FY2015–17 → FY2021–23 | Computer & mathematical occupations |
|---|---|---|
| Russian degree | 143,100 → 129,500 | 146,900 → 132,800 |
| German degree | 143,600 → 140,200 | 152,500 → 147,300 |
| All non-US degrees | 129,400 → 128,800 | 129,200 → 131,000 |
| US degree | 122,600 → 123,600 | 127,800 → 127,800 |
In current (not inflation-adjusted) dollars, the Russian quartiles were $88,700 / $110,000 / $132,000 in FY2015–17 and $95,000 / $117,000 / $150,000 in FY2021–23.
Why the Russian median fell relative to the others:
| Employer type | Share of Russian cases, FY2015–17 → FY2021–23 | Median offer, FY2024 $ |
|---|---|---|
| Big Tech (Microsoft, Google, Amazon, Meta, Apple, Intel) | 21% → 12% | 154,500 → 161,000 |
| IT firms with Russian engineering centres | 9% → 24% | 127,800 → 121,000 |
| All other employers | 70% → 65% | 138,200 → 132,500 |
About a third of the fall is the move from Big Tech, which pays most, to IT-services firms, which pay less: reweighting the FY2021–23 cases to the FY2015–17 mix of these three employer types gives a median of $134,600 instead of $129,500, so the mix accounts for about $5,100 of the $13,600 fall. The rest is lower offers within the IT-services firms and at the other employers.
By degree level (median offer, FY2024 $): master's 143,400 → 132,500; bachelor's 130,300 → 104,600; doctorate 120,400 → 125,800 (only 27 cases in FY2021–23, too few to read). The bachelor's offers fell most.
5. Which jobs, industries, fields and states
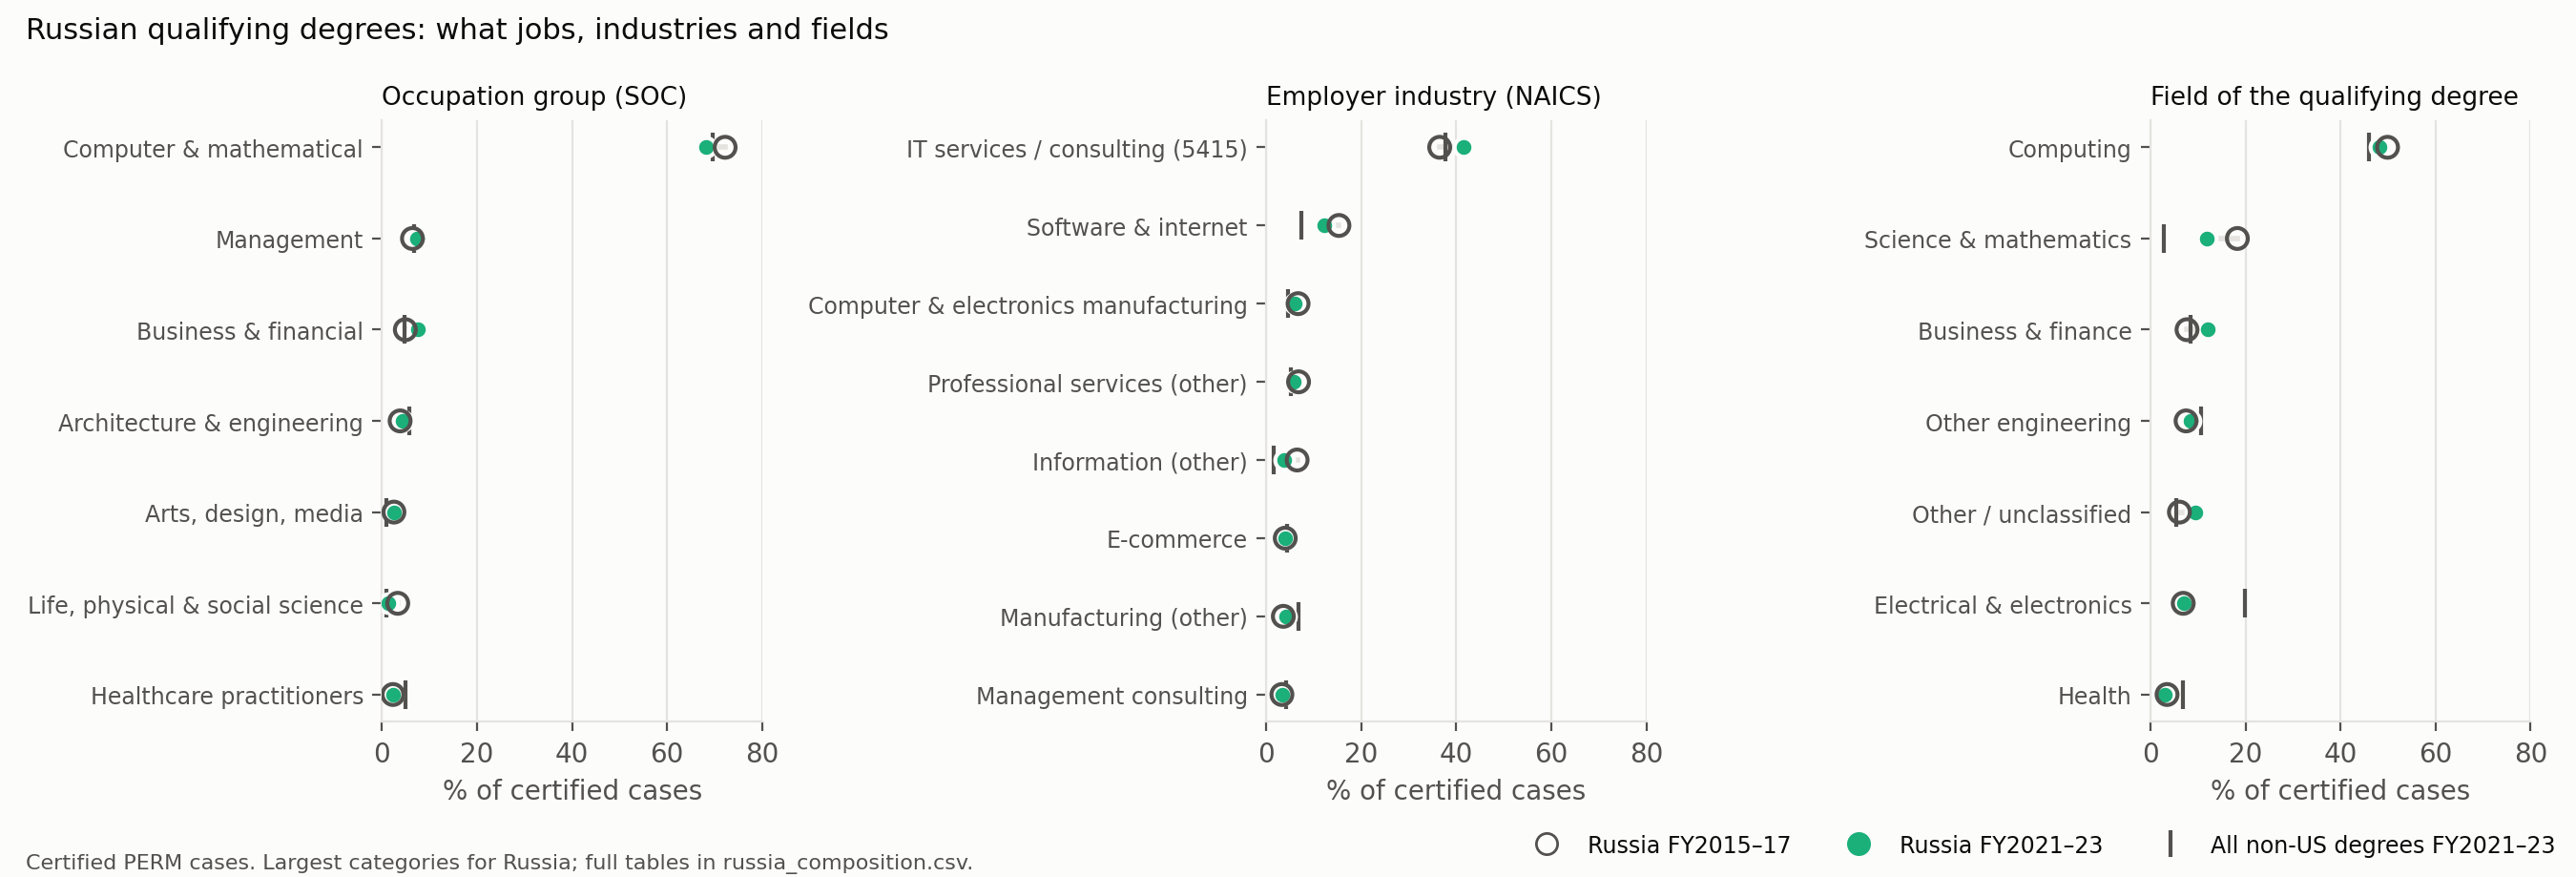
Hollow ring: Russia FY2015–17; filled dot: Russia FY2021–23; grey tick: all non-US degrees FY2021–23.
| Share of cases (%) | Russia FY2015–17 | Russia FY2021–23 | Germany FY2021–23 | All non-US FY2021–23 |
|---|---|---|---|---|
| Occupation (Standard Occupational Classification, SOC) | ||||
| Computer & mathematical | 72.2 | 68.1 | 36.5 | 69.5 |
| … of which software developers | 61.3 | 51.9 | 22.4 | 41.1 |
| Management | 6.4 | 7.3 | 18.8 | 6.7 |
| Business & financial | 4.9 | 7.6 | 9.6 | 4.8 |
| Life, physical & social science | 3.3 | 1.4 | 2.9 | 0.9 |
| Employer industry (North American Industry Classification System, NAICS) | ||||
| IT services / consulting (NAICS 5415) | 36.5 | 41.6 | 15.7 | 37.7 |
| Software & internet | 15.3 | 12.3 | 8.1 | 7.4 |
| Colleges & universities | 2.1 | 0.5 | 9.8 | 1.6 |
| Field of the qualifying degree | ||||
| Computing | 49.9 | 48.1 | 29.5 | 45.9 |
| Science & mathematics | 18.3 | 11.9 | 12.5 | 2.8 |
| Business & finance | 7.7 | 12.1 | 17.4 | 8.5 |
| Degree level | ||||
| Master's | 75.9 | 72.7 | 51.2 | 22.8 |
| Bachelor's | 14.2 | 20.2 | 21.9 | 69.6 |
| Doctorate | 5.7 | 2.9 | 21.5 | 1.9 |
| Work-site state | ||||
| California | 38.1 | 35.6 | 34.4 | 18.8 |
| New York | 9.7 | 12.9 | 10.3 | 10.7 |
| Washington | 11.5 | 6.8 | 8.1 | 7.6 |
| Pennsylvania | 2.5 | 11.7 | 2.5 | 2.8 |
- Russian-degree holders are a computing population, like other non-US degrees as a whole and unlike German ones (whose holders are spread over engineering, management and academia).
- Russian degrees in science and mathematics are much more common than for non-US degrees in general (12–18% against 3%). This reflects Russian maths and physics programmes, whose graduates work as software developers.
- Master's degrees dominate. The Russian five-year "specialist" degree is usually evaluated as equivalent to a US master's. Doctorates are few and falling (5.7% → 2.9%), unlike Germany (21.5%). Holders of Russian doctorates who go into research may use green-card routes that skip PERM (see "What the data cannot answer").
- Universities almost disappeared as sponsors (2.1% → 0.5%).
6. Is there a break after February 2022?
Not as a break. In the quarterly chart above, the Russian rate per 1,000 certified cases was 5.3–5.9 in 2019–20, drifted down to 4.3–4.9 in 2021 and 3.2 in the first quarter of 2022, then 1.6–3.3 through mid-2024. The decline began before February 2022, and Germany's rate fell in parallel (2.2–2.8 in 2021, 1.2–2.3 in 2022–24).
Timing matters here. A PERM case is filed after the employer obtains a prevailing-wage determination (which takes months) and is decided months after filing. FY2022 decisions therefore mostly concern jobs filed before February 2022; FY2023–24 is the first period in which an effect on filings could appear, and FY2024 is partial.
Smaller changes after 2022:
| Fiscal year | Cases | H-1B | L-1 | B-2 (visitor) | Not in the US |
|---|---|---|---|---|---|
| 2015 | 402 | 73.9% | 16.4% | 0.2% | 1.7% |
| 2017 | 436 | 52.5% | 30.5% | 1.8% | 1.8% |
| 2018 | 682 | 35.2% | 46.9% | 0.7% | 2.8% |
| 2020 | 424 | 34.2% | 41.0% | 4.0% | 3.5% |
| 2021 | 434 | 33.2% | 48.2% | 3.7% | 1.6% |
| 2022 | 297 | 30.3% | 40.7% | 6.7% | 4.0% |
| 2023 | 213 | 29.1% | 38.0% | 8.5% | 4.2% |
| 2024 (partial) | 177 | 25.4% | 32.2% | 9.6% | 7.3% |
Class of admission: the worker's visa status when the case was filed. H-1B is the temporary skilled-worker visa; L-1 the intra-company transfer visa; B-2 the visitor (tourist) visa.
- The move from H-1B to L-1 happened in FY2018, not in 2022, and Germany shows the same shift (L-1 19% → 37%), so it is not about Russia.
- After 2022, more cases were filed by people on visitor visas (about 4% → 7–10%) or outside the US (about 2–4% → 4–7%). These are 10–20 cases a year each.
- The IT firms with Russian engineering centres went from 120 cases (FY2021) to 72, 33 and 26 (FY2022–24); EPAM alone from 68 to 26, 6 and 12.
These changes involve few cases, and the data do not show what caused them.
What the data can and cannot answer
Can: for every case, the employer, job title and SOC occupation, the employer's NAICS industry, the work-site state, the offered wage, the degree level and major, the qualifying institution, citizenship, visa status at filing and the decision date, FY2015–2024.
Cannot:
- Actual earnings. The wage is the employer's offer for the sponsored job, which must be at least the prevailing wage for that job and place.
- Whether a green card was granted. Certification is one step; per-country visa limits and later stages decide the rest.
- Employment outside PERM. Workers who are never sponsored (for example, on H-1B only) are invisible, and so are the green-card routes that skip PERM: EB-1 (extraordinary ability, outstanding researchers) and the National Interest Waiver. Researchers and top scientists are therefore under-represented.
- Earlier degrees. Only the qualifying degree is recorded. A Russian bachelor's followed by a US master's counts as a US degree.
- The filing date. It was not extracted, so wages are deflated by the decision year. In years of high inflation (FY2022–23) this understates real offers by a few per cent, for all groups alike; comparisons between groups hold, but the absolute real fall is somewhat overstated.
Limitations
- Coverage. All 929 unmatched Russian institution names were matched by hand (762 matched, 163 ruled out as schools, placeholders or institutions ROR doesn't hold, 4 left ambiguous). Names from FY2015–19 carry no country, so they were found by Russian place and institution words. That rule finds about two-thirds of names known to be Russian, and most of what it misses are schools. Some early Russian cases may still be uncounted, so the true fall may be a little larger than −37%.
- The hand decisions have not yet been audited by a person; automatic checks found no errors.
- Small cells. Doctorates, per-university splits by period and FY2024 are small; tables flag groups under 30 cases.
- Light classifications. Employer grouping combines only a few company families. Degree fields come from keyword rules on free text (9% of Russian majors in FY2021–23 stay unclassified).
- Which firms had Russian engineering centres is general knowledge used to label a group of five firms; the data show only their visa pattern.
Method
Sample. Certified cases (Certified and Certified-Expired) that name an institution. A case counts as Russian when its institution was matched to a Russian ROR (Research Organization Registry) record, or when its exact spelling appears in FY2020+ cases that give Russia as the country (the country is "carried back" to earlier years). Cases known only from their own FY2020+ country field are left out of every group, so the definition is the same in every year; after the hand matching these are 110 cases, mostly schools. Germany, all non-US degrees and US degrees use the same rule.
Variables. Offered wage converted to a yearly amount (hour × 2,080, week × 52, two weeks × 26, month × 12; values outside $15,000–$1,000,000 treated as errors, 7 of 4,200 Russian cases) and deflated with the monthly CPI-U (FRED series CPIAUCNS) averaged over each fiscal year. Occupation: SOC major group, and detailed occupation with SOC 2010 and SOC 2018 codes for the same job merged. Industry: NAICS 4-digit groups.